 Română
  Русский
 English
 Bahasa Indonesia
 Bahasa Malay
 ไทย
ไทย Español
 Deutsch
 Български
 Français
 Tiếng Việt
 中文
中文 বাংলা
বাংলা हिन्दी
 Čeština
 Українська
FX.co ★ Patterns #Bitcoin | Bitcoin cryptocurrency Rate in the Forex market

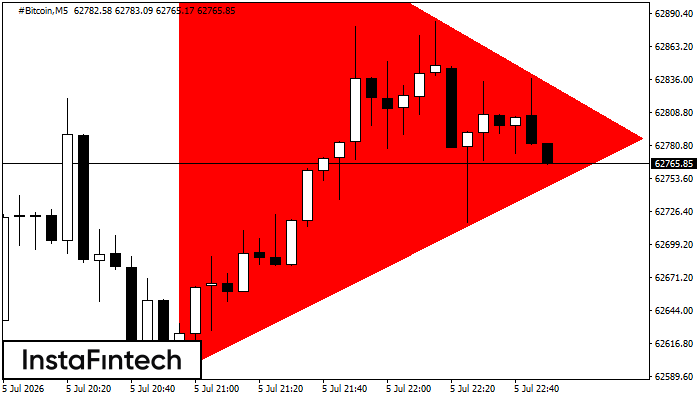
#Bitcoin M5
Bearish Symmetrical Triangle
According to the chart of M5, #Bitcoin formed the Bearish Symmetrical Triangle pattern. This pattern signals a further downward trend in case the lower border 62594.53 is breached. Here, a hypothetical profit will equal the width of the available pattern that is -41591 pips.
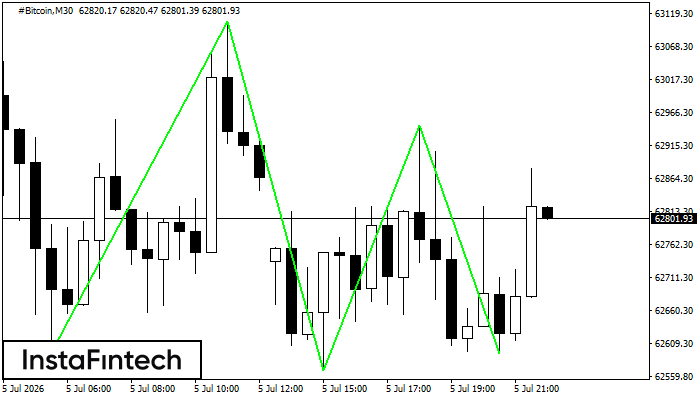
#Bitcoin M30
Triple Bottom
The Triple Bottom pattern has formed on the chart of the #Bitcoin M30 trading instrument. The pattern signals a change in the trend from downwards to upwards in the case of breakdown of 63106.35/62945.87.
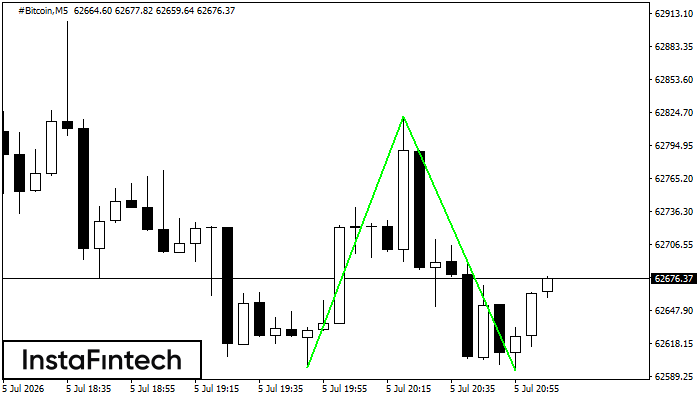
#Bitcoin M5
Double Bottom
The Double Bottom pattern has been formed on #Bitcoin M5. Characteristics: the support level 62597.03; the resistance level 62820.60; the width of the pattern 22357 points. If the resistance level is broken, a change in the trend can be predicted with the first target point lying at the distance of 22607 points.
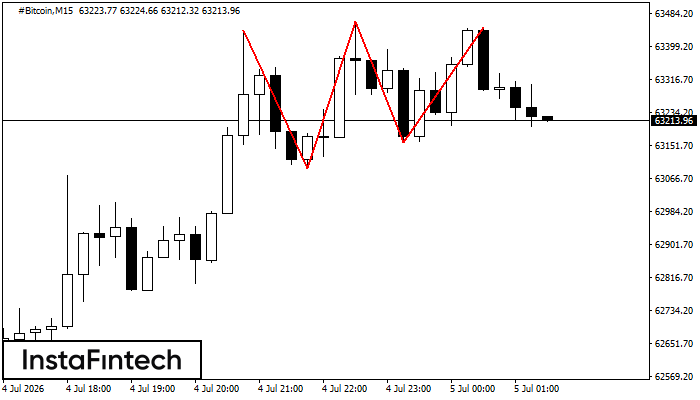
#Bitcoin M15
Triple Top
The Triple Top pattern has formed on the chart of the #Bitcoin M15. Features of the pattern: borders have an ascending angle; the lower line of the pattern has the coordinates 63092.00/63157.15 with the upper limit 63439.56/63448.99; the projection of the width is 34756 points. The formation of the Triple Top figure most likely indicates a change in the trend from upward to downward. This means that in the event of a breakdown of the support level of 63092.00, the price is most likely to continue the downward movement.
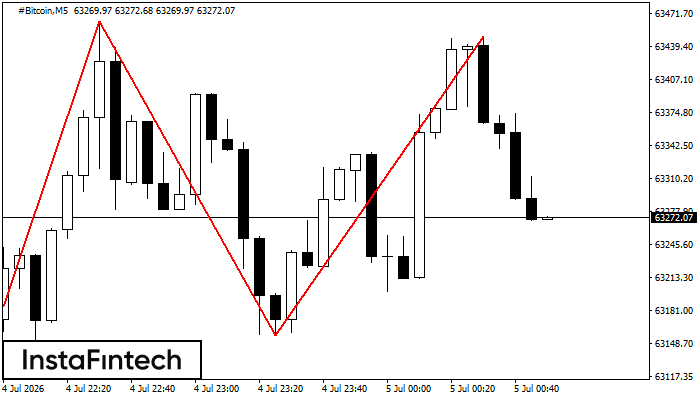
#Bitcoin M5
Triple Top
On the chart of the #Bitcoin M5 trading instrument, the Triple Top pattern that signals a trend change has formed. It is possible that after formation of the third peak, the price will try to break through the resistance level 63092.00, where we advise to open a trading position for sale. Take profit is the projection of the pattern’s width, which is 34756 points.
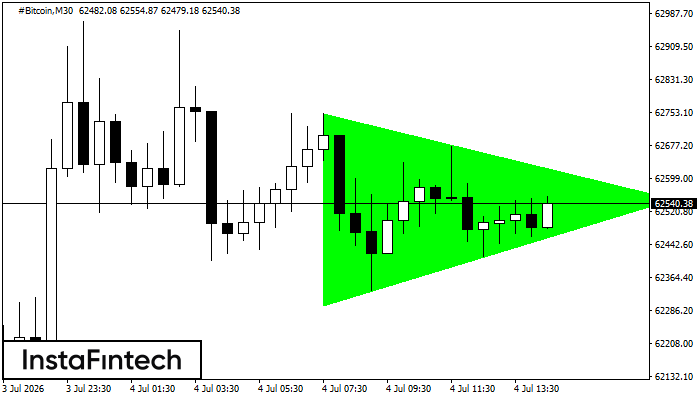
#Bitcoin M30
Bullish Symmetrical Triangle
According to the chart of M30, #Bitcoin formed the Bullish Symmetrical Triangle pattern, which signals the trend will continue. Description. The upper border of the pattern touches the coordinates 62750.91/62547.60 whereas the lower border goes across 62298.56/62547.60. The pattern width is measured on the chart at 45235 pips. If the Bullish Symmetrical Triangle pattern is in progress during the upward trend, this indicates the current trend will go on. In case 62547.60 is broken, the price could continue its move toward 62547.90.
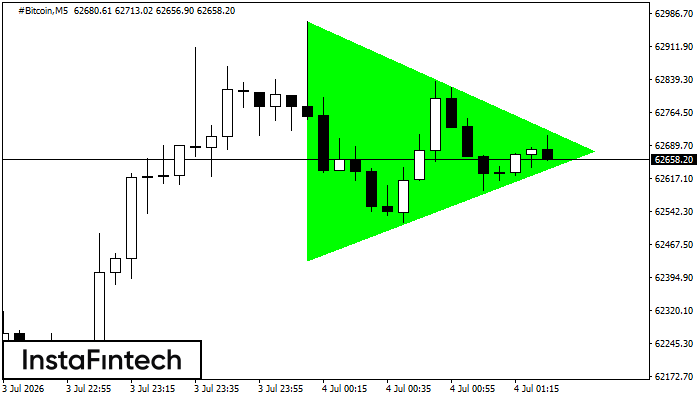
#Bitcoin M5
Bullish Symmetrical Triangle
According to the chart of M5, #Bitcoin formed the Bullish Symmetrical Triangle pattern. The lower border of the pattern touches the coordinates 62431.95/62676.60 whereas the upper border goes across 62968.85/62676.60. If the Bullish Symmetrical Triangle pattern is in progress, this evidently signals a further upward trend. In other words, in case the scenario comes true, the price of #Bitcoin will breach the upper border to head for 62676.75.
#Bitcoin M5
Double Top
The Double Top pattern has been formed on #Bitcoin M5. It signals that the trend has been changed from upwards to downwards. Probably, if the base of the pattern 61610.37 is broken, the downward movement will continue.
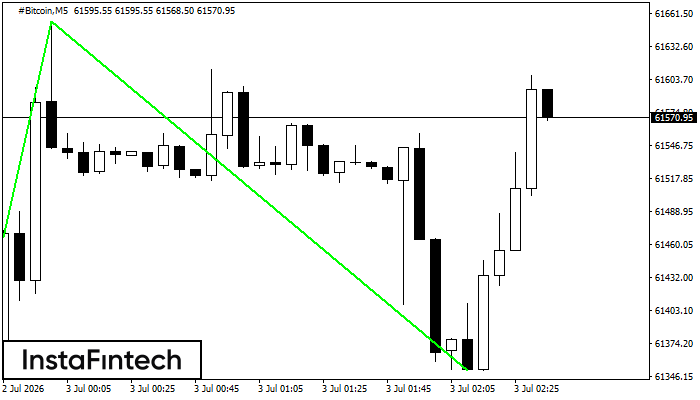
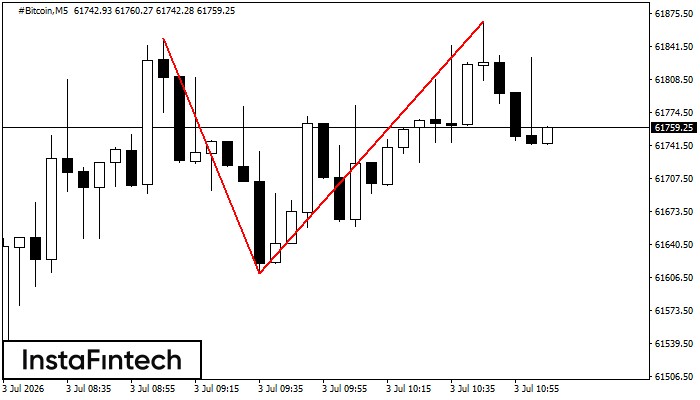
#Bitcoin M5
Double Bottom
The Double Bottom pattern has been formed on #Bitcoin M5; the upper boundary is 61654.19; the lower boundary is 61351.20. The width of the pattern is 31381 points. In case of a break of the upper boundary 61654.19, a change in the trend can be predicted where the width of the pattern will coincide with the distance to a possible take profit level.
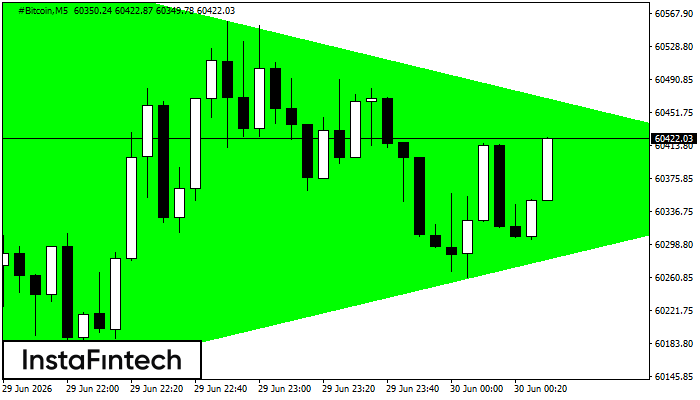
#Bitcoin M5
Bullish Symmetrical Triangle
According to the chart of M5, #Bitcoin formed the Bullish Symmetrical Triangle pattern. The lower border of the pattern touches the coordinates 60067.65/60374.53 whereas the upper border goes across 60684.62/60374.53. If the Bullish Symmetrical Triangle pattern is in progress, this evidently signals a further upward trend. In other words, in case the scenario comes true, the price of #Bitcoin will breach the upper border to head for 60374.68.