 Română
  Русский
 English
 Bahasa Indonesia
 Bahasa Malay
 ไทย
ไทย Español
 Deutsch
 Български
 Français
 Tiếng Việt
 中文
中文 বাংলা
বাংলা हिन्दी
 Čeština
 Українська
FX.co ★ Patterns EURCAD | Euro (EUR) to Canadian Dollar (CAD) Rate in the Forex market

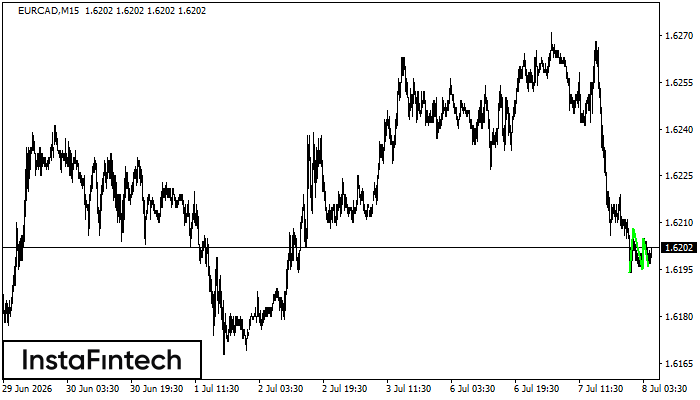
EURCAD M15
Triple Bottom
The Triple Bottom pattern has formed on the chart of EURCAD M15. Features of the pattern: The lower line of the pattern has coordinates 1.6208 with the upper limit 1.6208/1.6205, the projection of the width is 14 points. The formation of the Triple Bottom pattern most likely indicates a change in the trend from downward to upward. This means that in the event of a breakdown of the resistance level 1.6194, the price is most likely to continue the upward movement.
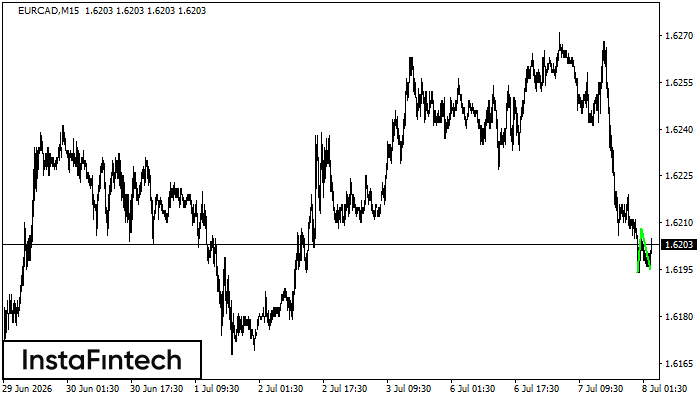
EURCAD M15
Double Bottom
The Double Bottom pattern has been formed on EURCAD M15. Characteristics: the support level 1.6194; the resistance level 1.6208; the width of the pattern 14 points. If the resistance level is broken, a change in the trend can be predicted with the first target point lying at the distance of 13 points.
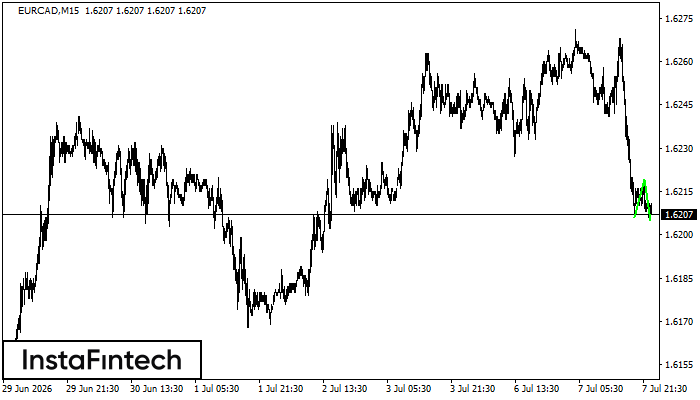
EURCAD M15
Double Bottom
The Double Bottom pattern has been formed on EURCAD M15; the upper boundary is 1.6219; the lower boundary is 1.6205. The width of the pattern is 13 points. In case of a break of the upper boundary 1.6219, a change in the trend can be predicted where the width of the pattern will coincide with the distance to a possible take profit level.
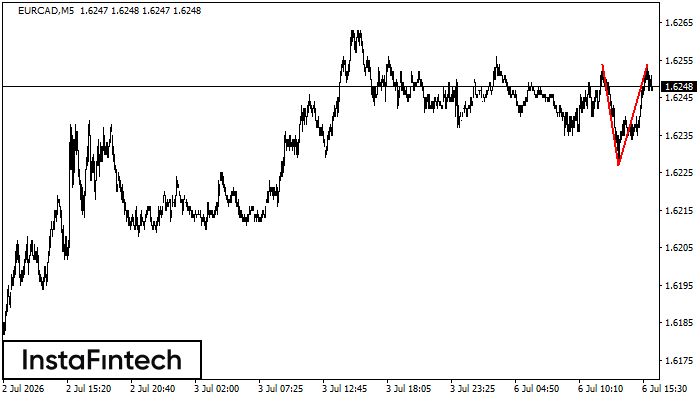
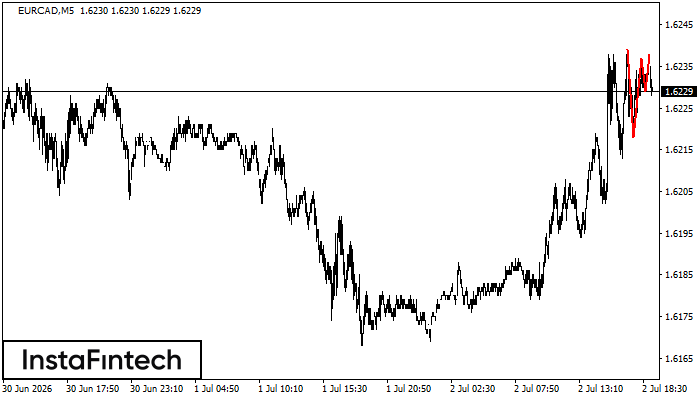
EURCAD M5
Double Top
On the chart of EURCAD M5 the Double Top reversal pattern has been formed. Characteristics: the upper boundary 1.6254; the lower boundary 1.6227; the width of the pattern 27 points. The signal: a break of the lower boundary will cause continuation of the downward trend targeting the 1.6212 level.
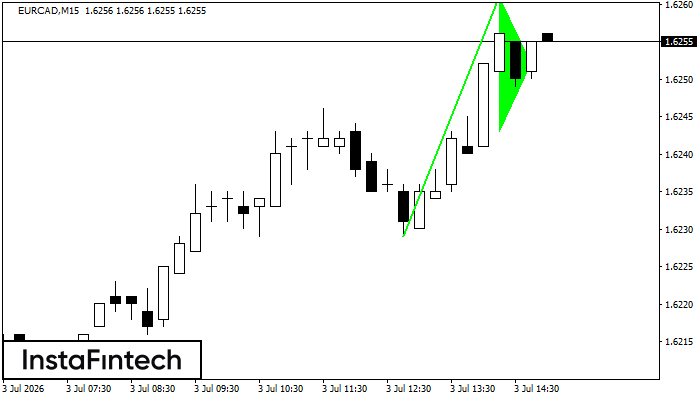
EURCAD M15
Bullish pennant
The Bullish pennant signal – Trading instrument EURCAD M15, continuation pattern. Forecast: it is possible to set up a buy position above the pattern’s high of 1.6261, with the prospect of the next move being a projection of the flagpole height.
EURCAD M5
Triple Top
The Triple Top pattern has formed on the chart of the EURCAD M5 trading instrument. It is a reversal pattern featuring the following characteristics: resistance level 1, support level -11, and pattern’s width 21. Forecast If the price breaks through the support level 1.6218, it is likely to move further down to 1.6222.
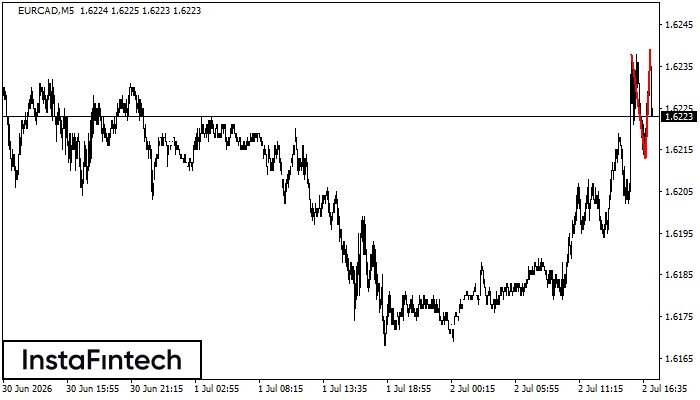
EURCAD M5
Double Top
The Double Top reversal pattern has been formed on EURCAD M5. Characteristics: the upper boundary 1.6238; the lower boundary 1.6213; the width of the pattern is 26 points. Sell trades are better to be opened below the lower boundary 1.6213 with a possible movements towards the 1.6198 level.
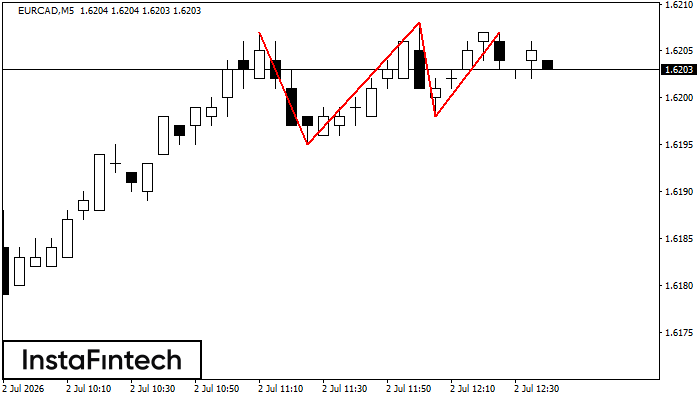
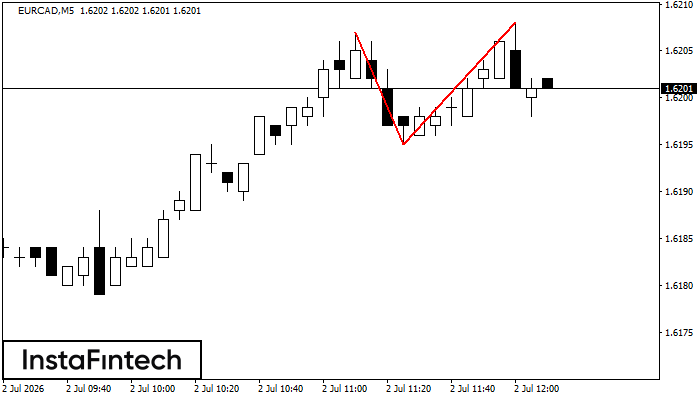
EURCAD M5
Triple Top
The Triple Top pattern has formed on the chart of the EURCAD M5. Features of the pattern: borders have an ascending angle; the lower line of the pattern has the coordinates 1.6195/1.6198 with the upper limit 1.6207/1.6207; the projection of the width is 12 points. The formation of the Triple Top figure most likely indicates a change in the trend from upward to downward. This means that in the event of a breakdown of the support level of 1.6195, the price is most likely to continue the downward movement.
EURCAD M5
Double Top
The Double Top reversal pattern has been formed on EURCAD M5. Characteristics: the upper boundary 1.6207; the lower boundary 1.6195; the width of the pattern is 13 points. Sell trades are better to be opened below the lower boundary 1.6195 with a possible movements towards the 1.6180 level.
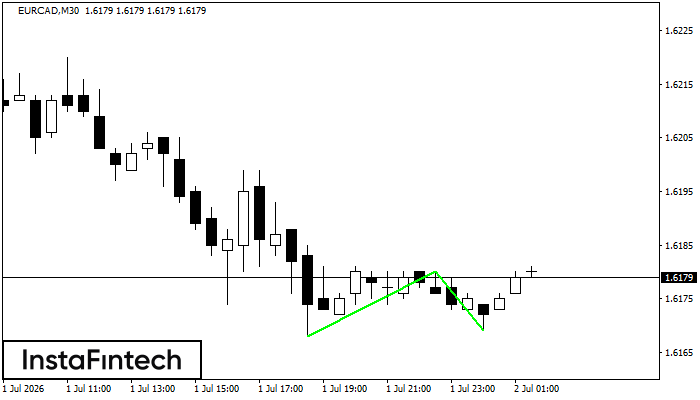
EURCAD M30
Double Bottom
The Double Bottom pattern has been formed on EURCAD M30; the upper boundary is 1.6180; the lower boundary is 1.6169. The width of the pattern is 12 points. In case of a break of the upper boundary 1.6180, a change in the trend can be predicted where the width of the pattern will coincide with the distance to a possible take profit level.