 Română
  Русский
 English
 Bahasa Indonesia
 Bahasa Malay
 ไทย
ไทย Español
 Deutsch
 Български
 Français
 Tiếng Việt
 中文
中文 বাংলা
বাংলা हिन्दी
 Čeština
 Українська
FX.co ★ Patterns EURJPY | Euro (EUR) to Japanese Yen (JPY) Rate in the Forex market

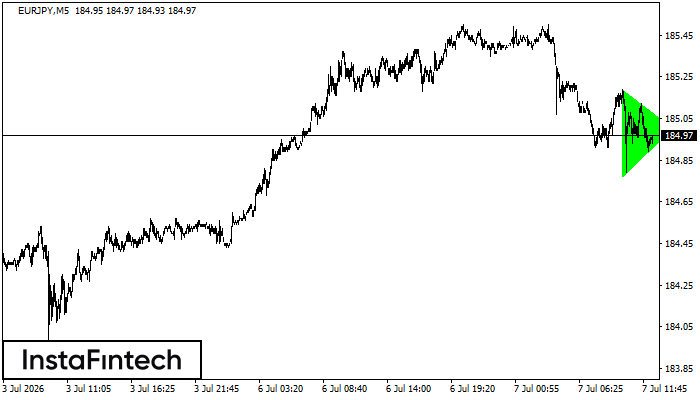
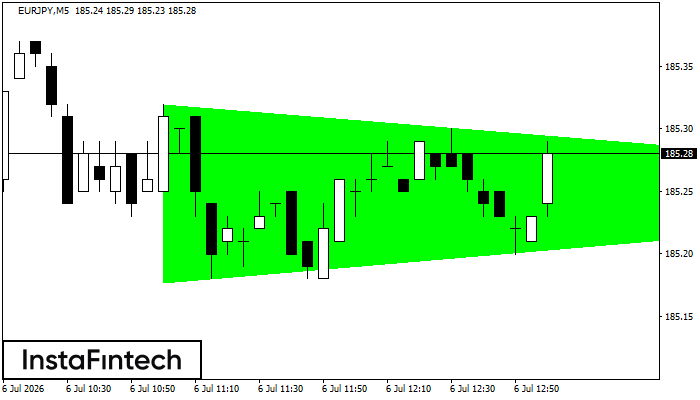
EURJPY M5
Bullish Symmetrical Triangle
According to the chart of M5, EURJPY formed the Bullish Symmetrical Triangle pattern. Description: This is the pattern of a trend continuation. 185.19 and 184.77 are the coordinates of the upper and lower borders respectively. The pattern width is measured on the chart at 42 pips. Outlook: If the upper border 185.19 is broken, the price is likely to continue its move by 185.15.
EURJPY M5
Double Bottom
The Double Bottom pattern has been formed on EURJPY M5. Characteristics: the support level 185.07; the resistance level 185.22; the width of the pattern 15 points. If the resistance level is broken, a change in the trend can be predicted with the first target point lying at the distance of 14 points.
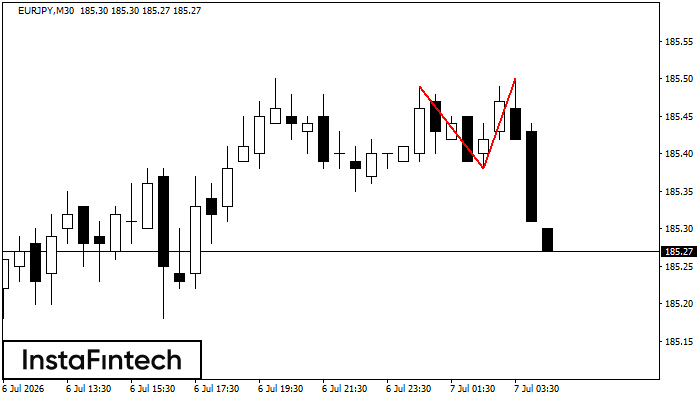
EURJPY M30
Double Top
On the chart of EURJPY M30 the Double Top reversal pattern has been formed. Characteristics: the upper boundary 185.50; the lower boundary 185.38; the width of the pattern 12 points. The signal: a break of the lower boundary will cause continuation of the downward trend targeting the 185.08 level.
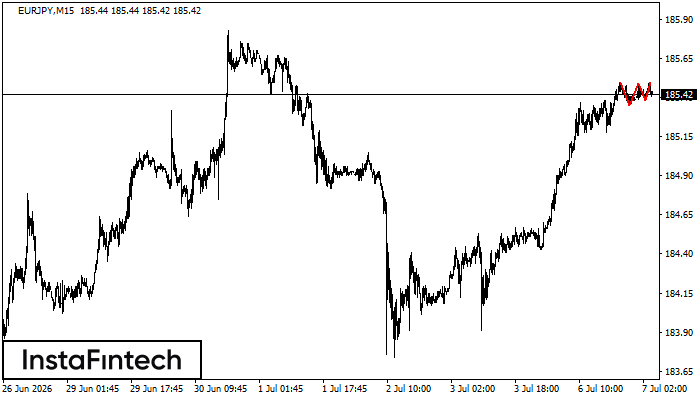
EURJPY M15
Triple Top
On the chart of the EURJPY M15 trading instrument, the Triple Top pattern that signals a trend change has formed. It is possible that after formation of the third peak, the price will try to break through the resistance level 185.35, where we advise to open a trading position for sale. Take profit is the projection of the pattern’s width, which is 15 points.
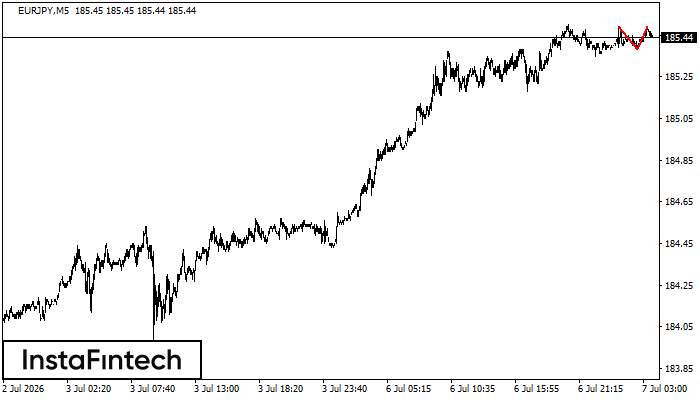
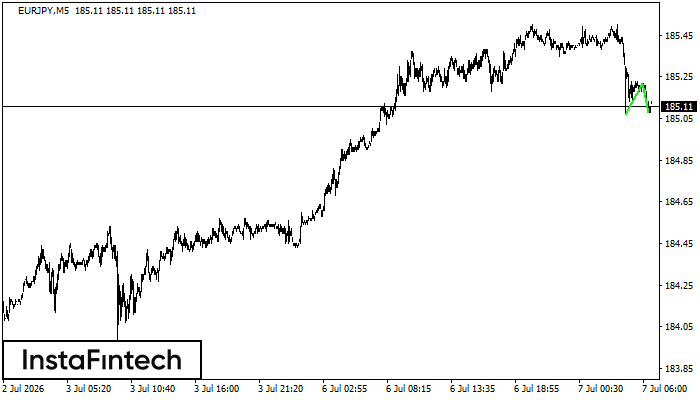
EURJPY M5
Double Top
The Double Top pattern has been formed on EURJPY M5. It signals that the trend has been changed from upwards to downwards. Probably, if the base of the pattern 185.38 is broken, the downward movement will continue.
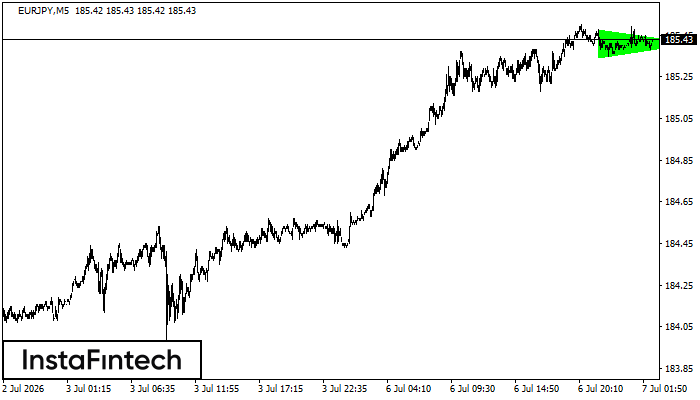
EURJPY M5
Bullish Symmetrical Triangle
According to the chart of M5, EURJPY formed the Bullish Symmetrical Triangle pattern, which signals the trend will continue. Description. The upper border of the pattern touches the coordinates 185.48/185.41 whereas the lower border goes across 185.34/185.41. The pattern width is measured on the chart at 14 pips. If the Bullish Symmetrical Triangle pattern is in progress during the upward trend, this indicates the current trend will go on. In case 185.41 is broken, the price could continue its move toward 185.56.
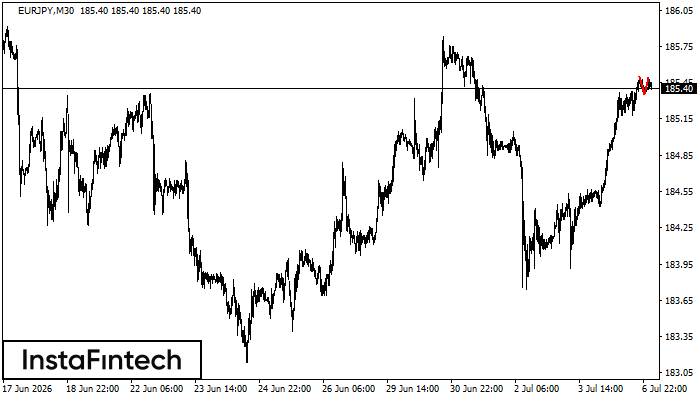
EURJPY M30
Double Top
The Double Top pattern has been formed on EURJPY M30. It signals that the trend has been changed from upwards to downwards. Probably, if the base of the pattern 185.35 is broken, the downward movement will continue.
EURJPY M5
Bullish Symmetrical Triangle
According to the chart of M5, EURJPY formed the Bullish Symmetrical Triangle pattern. Description: This is the pattern of a trend continuation. 185.32 and 185.18 are the coordinates of the upper and lower borders respectively. The pattern width is measured on the chart at 14 pips. Outlook: If the upper border 185.32 is broken, the price is likely to continue its move by 185.40.
EURJPY M5
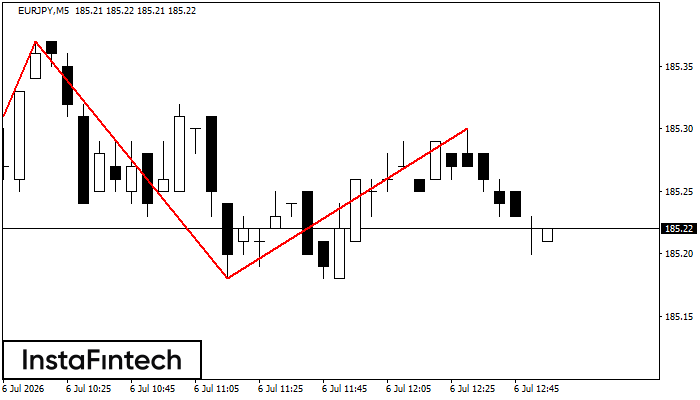
Head and Shoulders
According to the chart of M5, EURJPY formed the Head and Shoulders pattern. The Head’s top is set at 185.37 while the median line of the Neck is found at 185.16/185.18. The formation of the Head and Shoulders pattern evidently signals a reversal of the upward trend. In other words, in case the scenario comes true, the price of EURJPY will go towards 185.03.
EURJPY M5
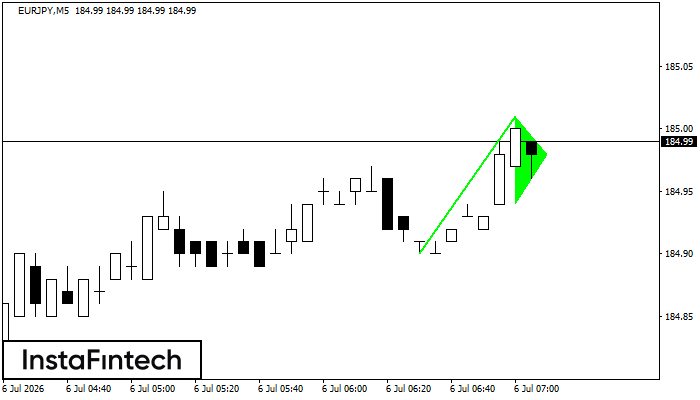
Bullish pennant
The Bullish pennant graphic pattern has formed on the EURJPY M5 instrument. This pattern type falls under the category of continuation patterns. In this case, if the quote can breaks out high, is expected to continue the upward trend to level 185.16.