 Română
  Русский
 English
 Bahasa Indonesia
 Bahasa Malay
 ไทย
ไทย Español
 Deutsch
 Български
 Français
 Tiếng Việt
 中文
中文 বাংলা
বাংলা हिन्दी
 Čeština
 Українська
FX.co ★ Patterns EURNZD | Euro (EUR) to New Zealand Dollar (NZD) Rate in the Forex market

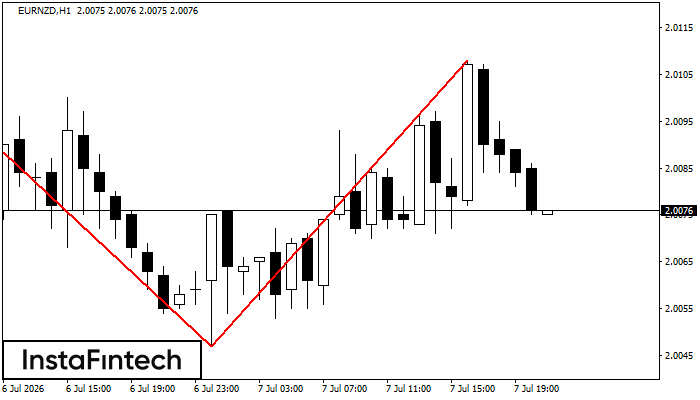
EURNZD H1
Double Top
The Double Top reversal pattern has been formed on EURNZD H1. Characteristics: the upper boundary 2.0104; the lower boundary 2.0047; the width of the pattern is 61 points. Sell trades are better to be opened below the lower boundary 2.0047 with a possible movements towards the 2.0007 level.
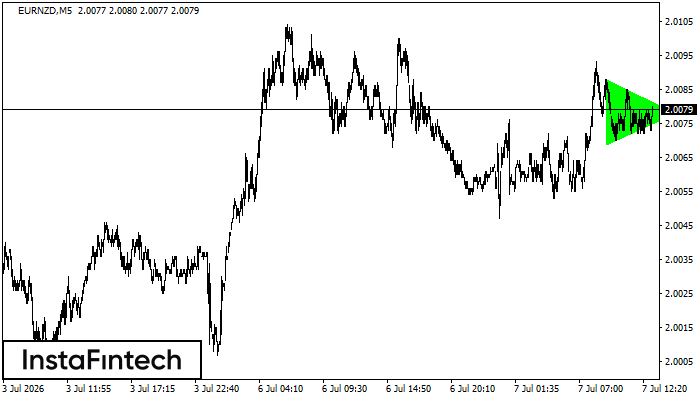
EURNZD M5
Bullish Symmetrical Triangle
According to the chart of M5, EURNZD formed the Bullish Symmetrical Triangle pattern, which signals the trend will continue. Description. The upper border of the pattern touches the coordinates 2.0088/2.0078 whereas the lower border goes across 2.0069/2.0078. The pattern width is measured on the chart at 19 pips. If the Bullish Symmetrical Triangle pattern is in progress during the upward trend, this indicates the current trend will go on. In case 2.0078 is broken, the price could continue its move toward 2.0093.
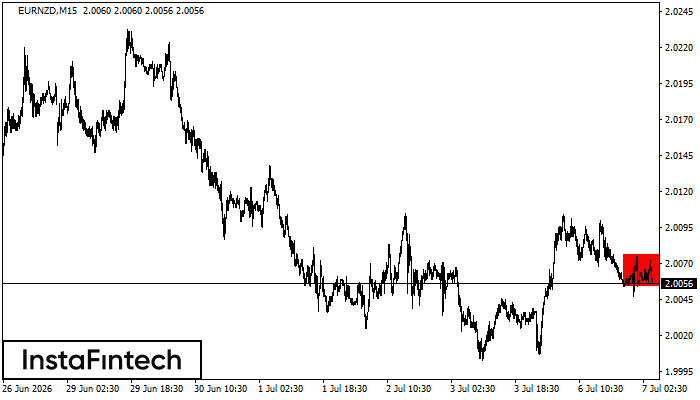
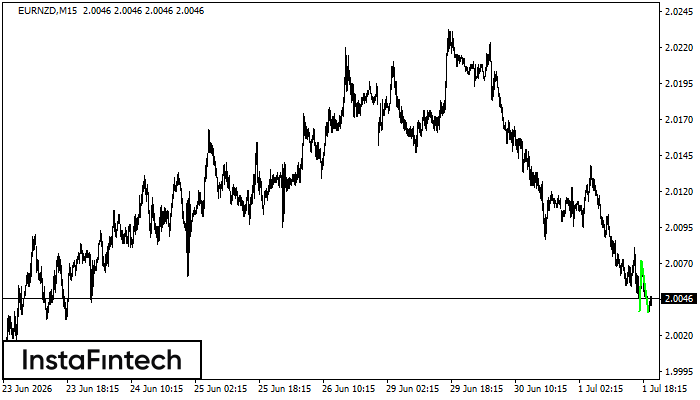
EURNZD M15
Bearish Rectangle
According to the chart of M15, EURNZD formed the Bearish Rectangle. This type of a pattern indicates a trend continuation. It consists of two levels: resistance 2.0076 - 0.0000 and support 2.0054 – 2.0054. In case the resistance level 2.0054 - 2.0054 is broken, the instrument is likely to follow the bearish trend.
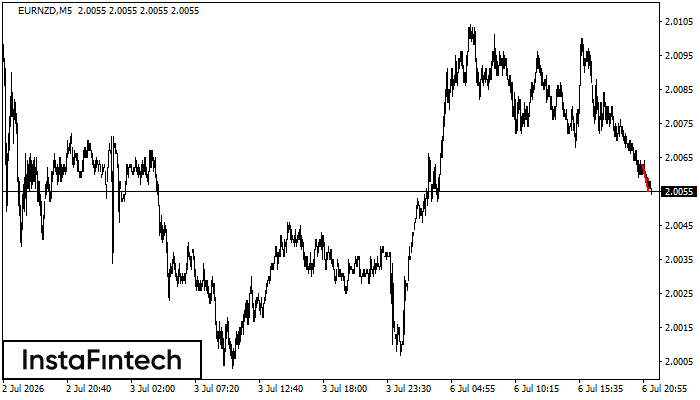
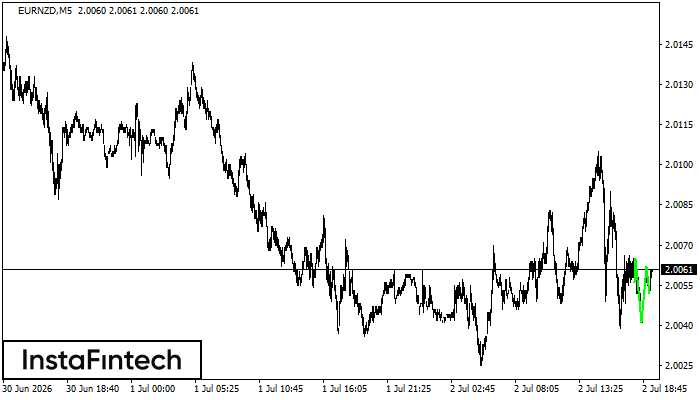
EURNZD M5
Bearish pennant
The Bearish pennant pattern has formed on the EURNZD M5 chart. This pattern type is characterized by a slight slowdown after which the price will move in the direction of the original trend. In case the price fixes below the pattern’s low of 2.0055, a trader will be able to successfully enter the sell position.
EURNZD M15
Bullish Symmetrical Triangle
According to the chart of M15, EURNZD formed the Bullish Symmetrical Triangle pattern. The lower border of the pattern touches the coordinates 2.0070/2.0085 whereas the upper border goes across 2.0101/2.0085. If the Bullish Symmetrical Triangle pattern is in progress, this evidently signals a further upward trend. In other words, in case the scenario comes true, the price of EURNZD will breach the upper border to head for 2.0108.
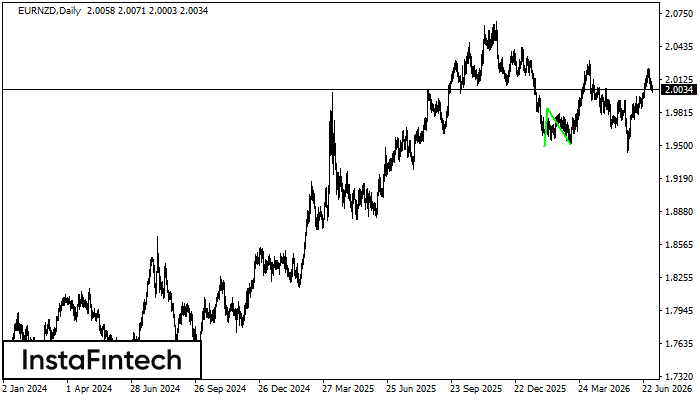
EURNZD D1
Double Bottom
The Double Bottom pattern has been formed on EURNZD D1; the upper boundary is 1.9851; the lower boundary is 1.9509. The width of the pattern is 355 points. In case of a break of the upper boundary 1.9851, a change in the trend can be predicted where the width of the pattern will coincide with the distance to a possible take profit level.
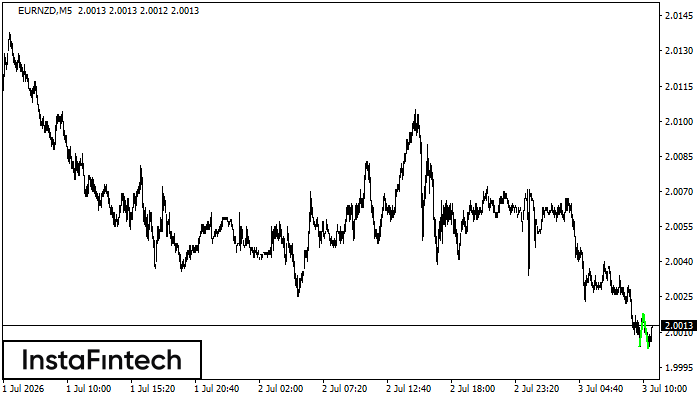
EURNZD M5
Double Bottom
The Double Bottom pattern has been formed on EURNZD M5. Characteristics: the support level 2.0004; the resistance level 2.0018; the width of the pattern 14 points. If the resistance level is broken, a change in the trend can be predicted with the first target point lying at the distance of 15 points.
EURNZD M5
Inverse Head and Shoulder
According to M5, EURNZD is shaping the technical pattern – the Inverse Head and Shoulder. In case the Neckline 2.0065/2.0062 is broken out, the instrument is likely to move toward 2.0077.
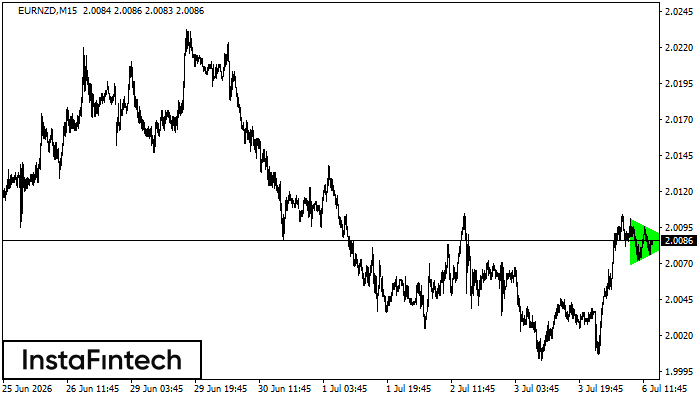
EURNZD M15
Double Bottom
The Double Bottom pattern has been formed on EURNZD M15; the upper boundary is 2.0072; the lower boundary is 2.0036. The width of the pattern is 35 points. In case of a break of the upper boundary 2.0072, a change in the trend can be predicted where the width of the pattern will coincide with the distance to a possible take profit level.