 Română
  Русский
 English
 Bahasa Indonesia
 Bahasa Malay
 ไทย
ไทย Español
 Deutsch
 Български
 Français
 Tiếng Việt
 中文
中文 বাংলা
বাংলা हिन्दी
 Čeština
 Українська
FX.co ★ Patterns GBPJPY | British Pound (GBP) to Japanese Yen (JPY) Rate in the Forex market

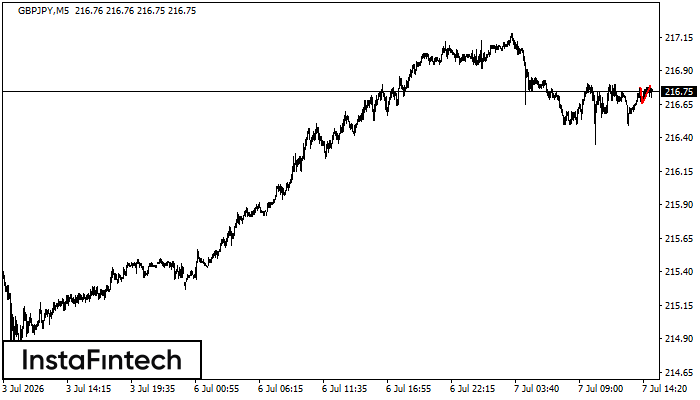
GBPJPY M5
Double Top
The Double Top reversal pattern has been formed on GBPJPY M5. Characteristics: the upper boundary 216.78; the lower boundary 216.66; the width of the pattern is 13 points. Sell trades are better to be opened below the lower boundary 216.66 with a possible movements towards the 216.51 level.
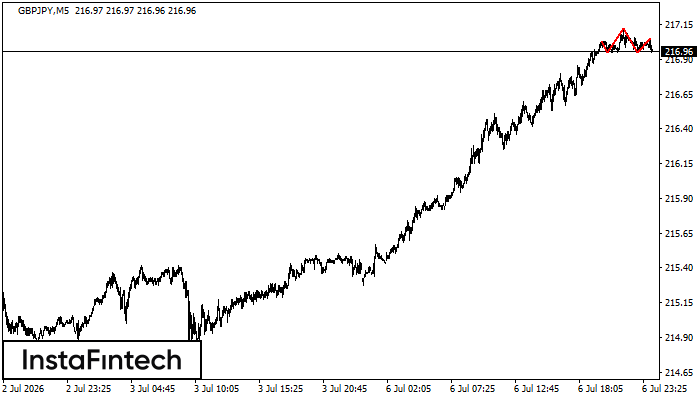
GBPJPY M5
Head and Shoulders
The GBPJPY M5 formed the Head and Shoulders pattern with the following features: The Head’s top is at 217.12, the Neckline and the upward angle are at 216.95/216.95. The formation of this pattern can bring about changes in the current trend from bullish to bearish. In case the pattern triggers the expected changes, the price of GBPJPY will go towards 216.80.
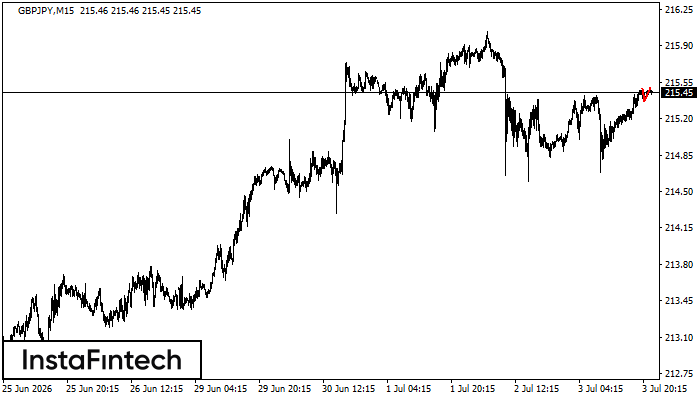
GBPJPY M15
Double Top
On the chart of GBPJPY M15 the Double Top reversal pattern has been formed. Characteristics: the upper boundary 215.50; the lower boundary 215.36; the width of the pattern 14 points. The signal: a break of the lower boundary will cause continuation of the downward trend targeting the 215.13 level.
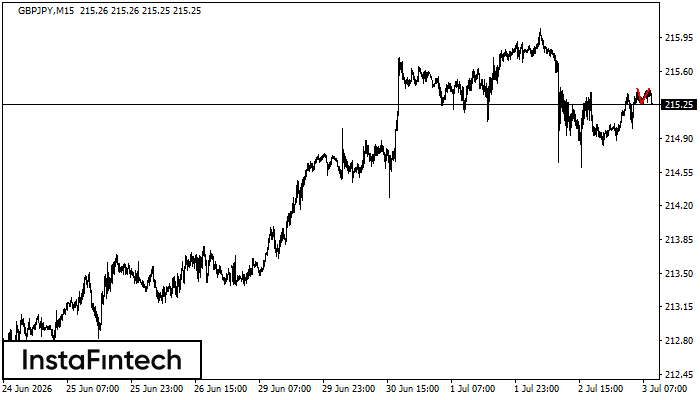
GBPJPY M15
Double Top
The Double Top reversal pattern has been formed on GBPJPY M15. Characteristics: the upper boundary 215.42; the lower boundary 215.27; the width of the pattern is 15 points. Sell trades are better to be opened below the lower boundary 215.27 with a possible movements towards the 215.04 level.
GBPJPY M5
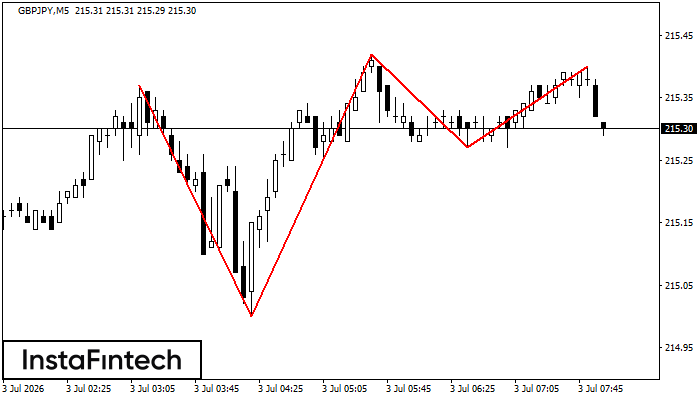
Triple Top
On the chart of the GBPJPY M5 trading instrument, the Triple Top pattern that signals a trend change has formed. It is possible that after formation of the third peak, the price will try to break through the resistance level 215.27, where we advise to open a trading position for sale. Take profit is the projection of the pattern’s width, which is 15 points.
GBPJPY M5
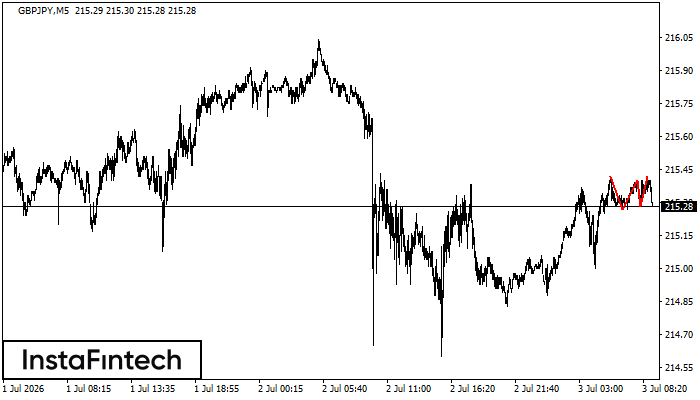
Triple Top
On the chart of the GBPJPY M5 trading instrument, the Triple Top pattern that signals a trend change has formed. It is possible that after formation of the third peak, the price will try to break through the resistance level 215.00, where we advise to open a trading position for sale. Take profit is the projection of the pattern’s width, which is 37 points.
GBPJPY H1
Bullish Symmetrical Triangle
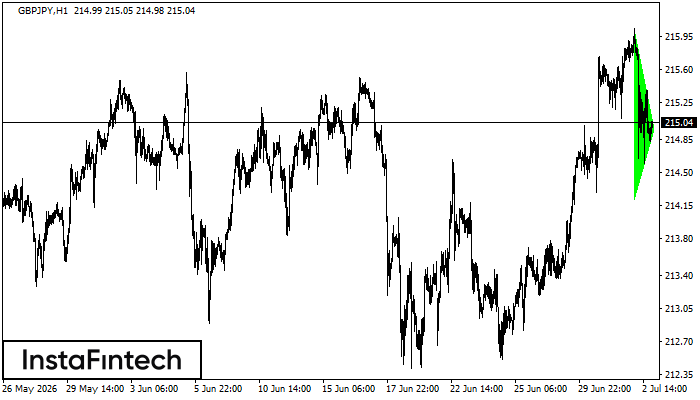
According to the chart of H1, GBPJPY formed the Bullish Symmetrical Triangle pattern. The lower border of the pattern touches the coordinates 214.22/214.96 whereas the upper border goes across 216.04/214.96. If the Bullish Symmetrical Triangle pattern is in progress, this evidently signals a further upward trend. In other words, in case the scenario comes true, the price of GBPJPY will breach the upper border to head for 215.36.
GBPJPY M5
Double Top
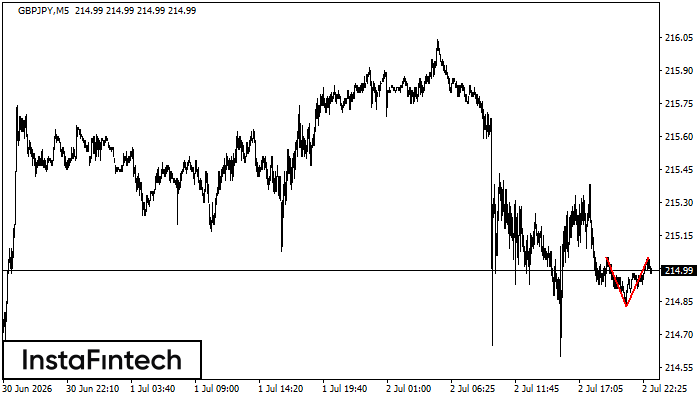
The Double Top reversal pattern has been formed on GBPJPY M5. Characteristics: the upper boundary 215.05; the lower boundary 214.83; the width of the pattern is 22 points. Sell trades are better to be opened below the lower boundary 214.83 with a possible movements towards the 214.68 level.
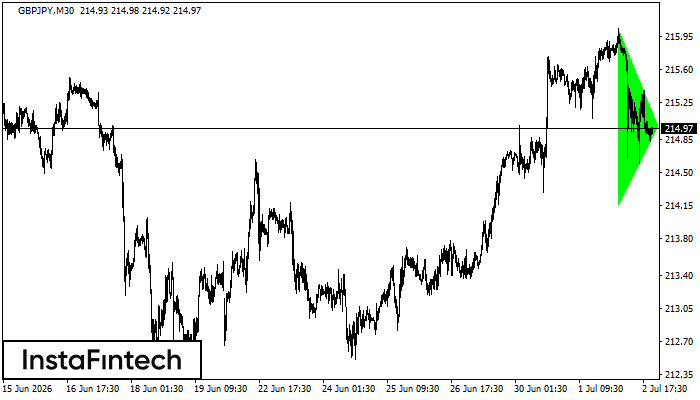
GBPJPY M30
Bullish Symmetrical Triangle
According to the chart of M30, GBPJPY formed the Bullish Symmetrical Triangle pattern. The lower border of the pattern touches the coordinates 214.16/214.99 whereas the upper border goes across 216.04/214.99. If the Bullish Symmetrical Triangle pattern is in progress, this evidently signals a further upward trend. In other words, in case the scenario comes true, the price of GBPJPY will breach the upper border to head for 215.29.
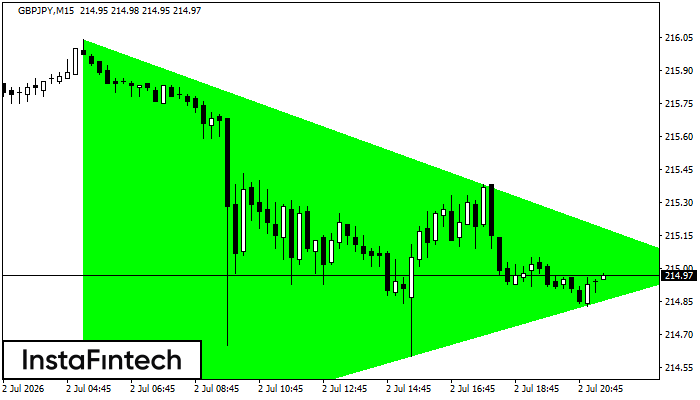
GBPJPY M15
Bullish Symmetrical Triangle
According to the chart of M15, GBPJPY formed the Bullish Symmetrical Triangle pattern. The lower border of the pattern touches the coordinates 214.17/215.00 whereas the upper border goes across 216.04/215.00. If the Bullish Symmetrical Triangle pattern is in progress, this evidently signals a further upward trend. In other words, in case the scenario comes true, the price of GBPJPY will breach the upper border to head for 215.23.