 Română
  Русский
 English
 Bahasa Indonesia
 Bahasa Malay
 ไทย
ไทย Español
 Deutsch
 Български
 Français
 Tiếng Việt
 中文
中文 বাংলা
বাংলা हिन्दी
 Čeština
 Українська
FX.co ★ Patterns GBPUSD | British Pound (GBP) to US Dollar (USD) Rate in the Forex market

GBPUSD M5
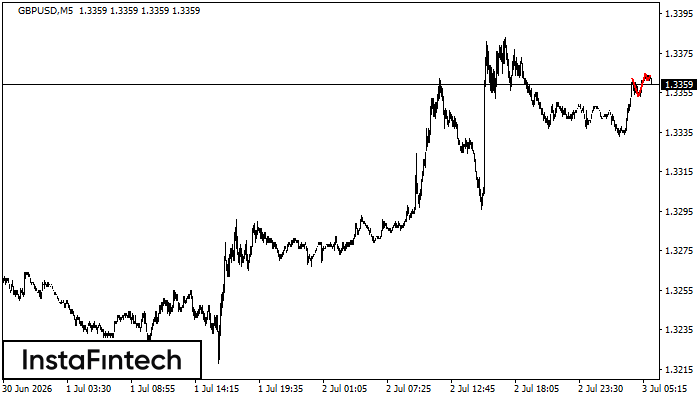
Triple Top
The Triple Top pattern has formed on the chart of the GBPUSD M5. Features of the pattern: borders have an ascending angle; the lower line of the pattern has the coordinates 1.3353/1.3361 with the upper limit 1.3362/1.3364; the projection of the width is 9 points. The formation of the Triple Top figure most likely indicates a change in the trend from upward to downward. This means that in the event of a breakdown of the support level of 1.3353, the price is most likely to continue the downward movement.
GBPUSD M5
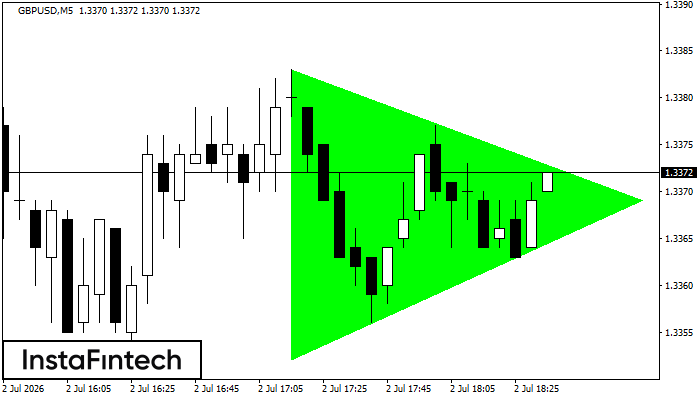
Bullish Symmetrical Triangle
According to the chart of M5, GBPUSD formed the Bullish Symmetrical Triangle pattern. The lower border of the pattern touches the coordinates 1.3352/1.3369 whereas the upper border goes across 1.3383/1.3369. If the Bullish Symmetrical Triangle pattern is in progress, this evidently signals a further upward trend. In other words, in case the scenario comes true, the price of GBPUSD will breach the upper border to head for 1.3384.
GBPUSD M5
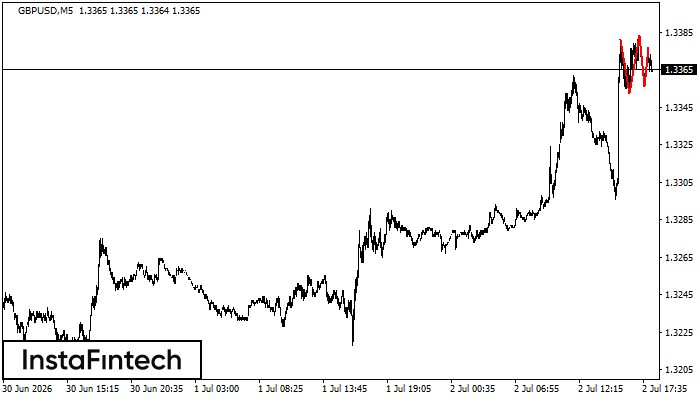
Triple Top
The Triple Top pattern has formed on the chart of the GBPUSD M5. Features of the pattern: borders have an ascending angle; the lower line of the pattern has the coordinates 1.3352/1.3356 with the upper limit 1.3381/1.3377; the projection of the width is 29 points. The formation of the Triple Top figure most likely indicates a change in the trend from upward to downward. This means that in the event of a breakdown of the support level of 1.3352, the price is most likely to continue the downward movement.
GBPUSD M5
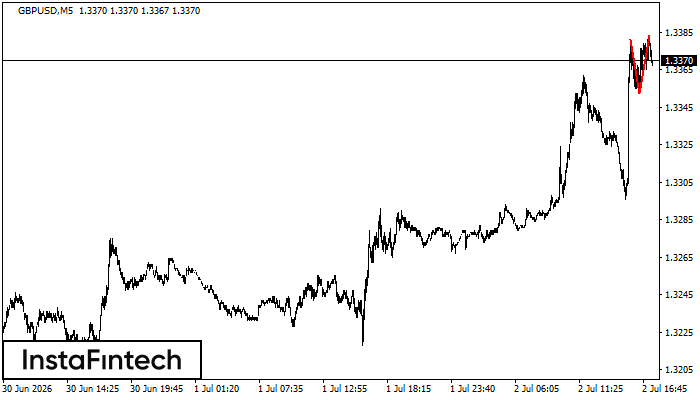
Double Top
The Double Top reversal pattern has been formed on GBPUSD M5. Characteristics: the upper boundary 1.3381; the lower boundary 1.3352; the width of the pattern is 31 points. Sell trades are better to be opened below the lower boundary 1.3352 with a possible movements towards the 1.3337 level.
GBPUSD M15
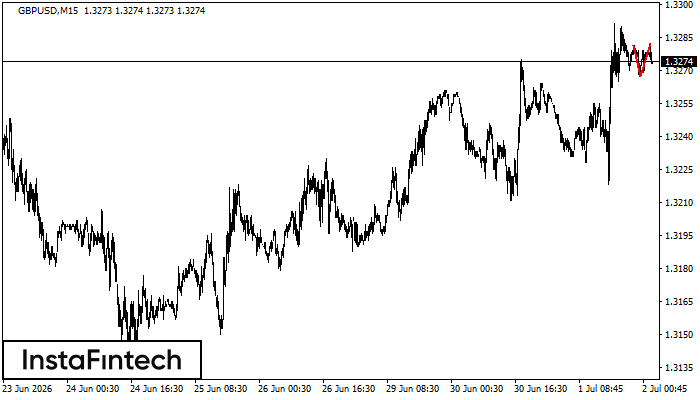
Double Top
The Double Top reversal pattern has been formed on GBPUSD M15. Characteristics: the upper boundary 1.3281; the lower boundary 1.3267; the width of the pattern is 15 points. Sell trades are better to be opened below the lower boundary 1.3267 with a possible movements towards the 1.3245 level.
GBPUSD M15
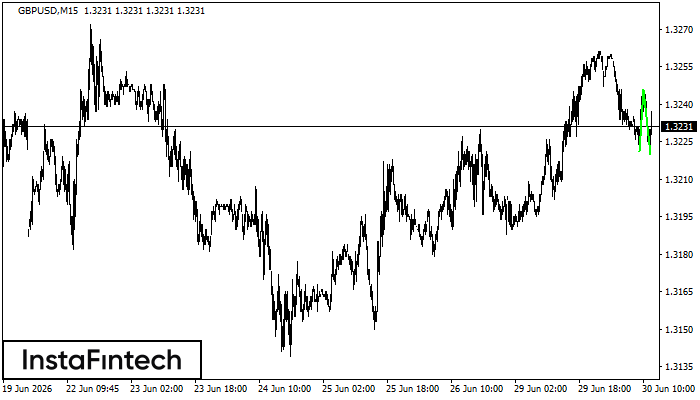
Double Bottom
The Double Bottom pattern has been formed on GBPUSD M15; the upper boundary is 1.3246; the lower boundary is 1.3220. The width of the pattern is 25 points. In case of a break of the upper boundary 1.3246, a change in the trend can be predicted where the width of the pattern will coincide with the distance to a possible take profit level.
GBPUSD M5
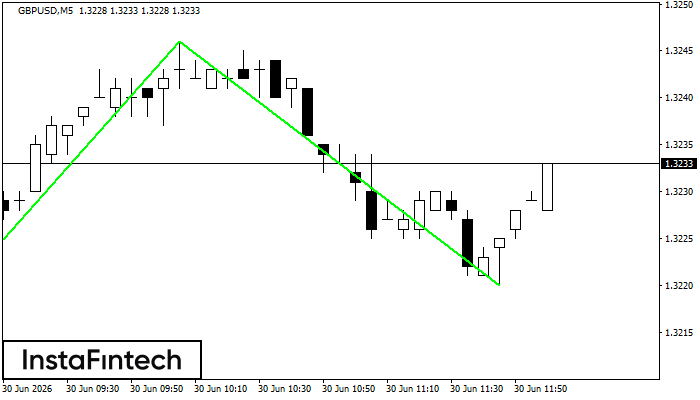
Double Bottom
The Double Bottom pattern has been formed on GBPUSD M5. Characteristics: the support level 1.3221; the resistance level 1.3246; the width of the pattern 25 points. If the resistance level is broken, a change in the trend can be predicted with the first target point lying at the distance of 26 points.
GBPUSD M30
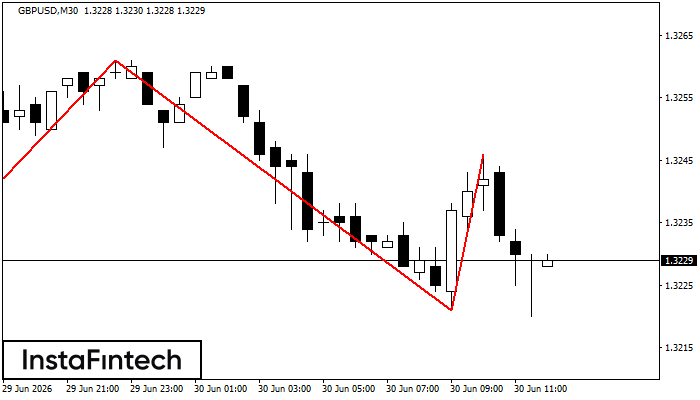
Head and Shoulders
The technical pattern called Head and Shoulders has appeared on the chart of GBPUSD M30. There are weighty reasons to suggest that the price will surpass the Neckline 1.3202/1.3221 after the right shoulder has been formed. So, the trend is set to change with the price heading for 1.3191.
GBPUSD M30
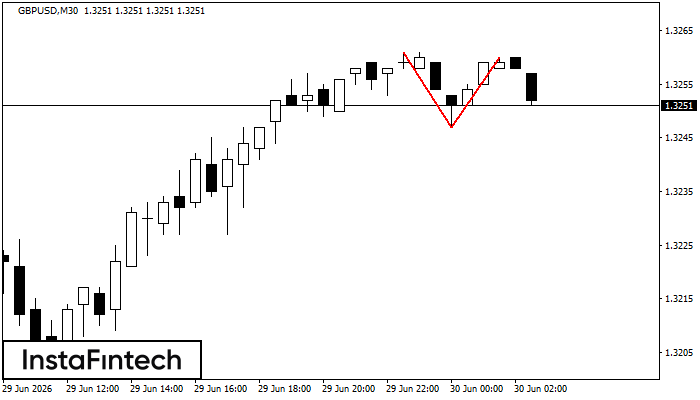
Double Top
The Double Top pattern has been formed on GBPUSD M30. It signals that the trend has been changed from upwards to downwards. Probably, if the base of the pattern 1.3247 is broken, the downward movement will continue.
GBPUSD M5
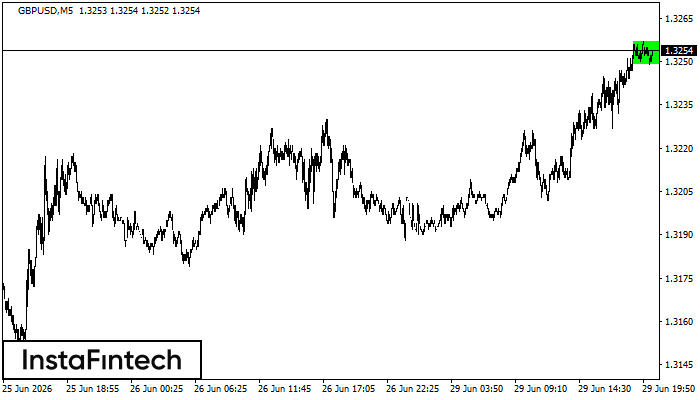
Bullish Rectangle
According to the chart of M5, GBPUSD formed the Bullish Rectangle. The pattern indicates a trend continuation. The upper border is 1.3257, the lower border is 1.3249. The signal means that a long position should be opened above the upper border 1.3257 of the Bullish Rectangle.