 Română
  Русский
 English
 Bahasa Indonesia
 Bahasa Malay
 ไทย
ไทย Español
 Deutsch
 Български
 Français
 Tiếng Việt
 中文
中文 বাংলা
বাংলা हिन्दी
 Čeština
 Українська
FX.co ★ Patterns #MSFT | Microsoft Corporation Stock Price

#MSFT M5
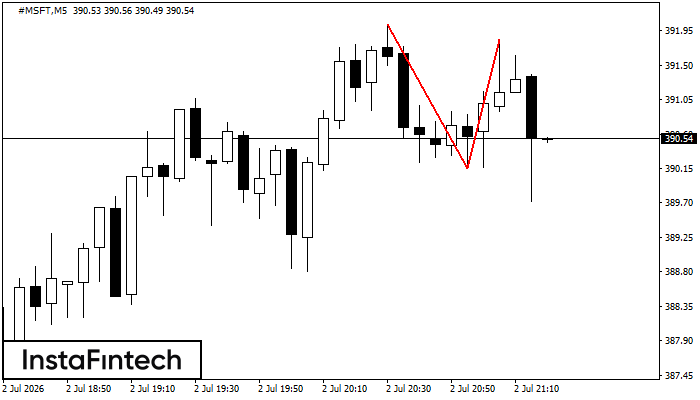
Double Top
The Double Top pattern has been formed on #MSFT M5. It signals that the trend has been changed from upwards to downwards. Probably, if the base of the pattern 390.15 is broken, the downward movement will continue.
#MSFT M5
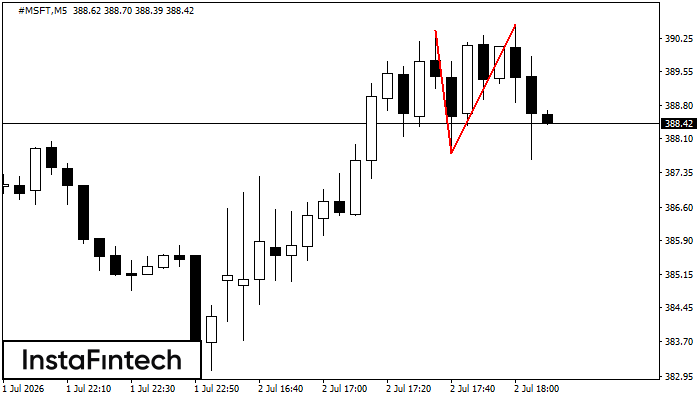
Double Top
On the chart of #MSFT M5 the Double Top reversal pattern has been formed. Characteristics: the upper boundary 390.55; the lower boundary 387.77; the width of the pattern 278 points. The signal: a break of the lower boundary will cause continuation of the downward trend targeting the 387.62 level.
#MSFT M5
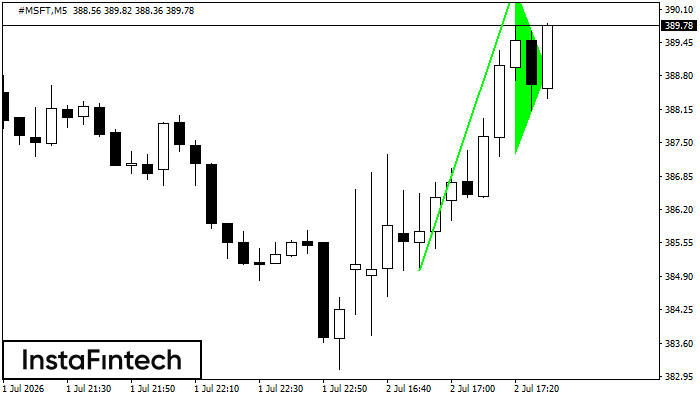
Bullish pennant
The Bullish pennant graphic pattern has formed on the #MSFT M5 instrument. This pattern type falls under the category of continuation patterns. In this case, if the quote can breaks out high, is expected to continue the upward trend to level 390.66.
#MSFT M5
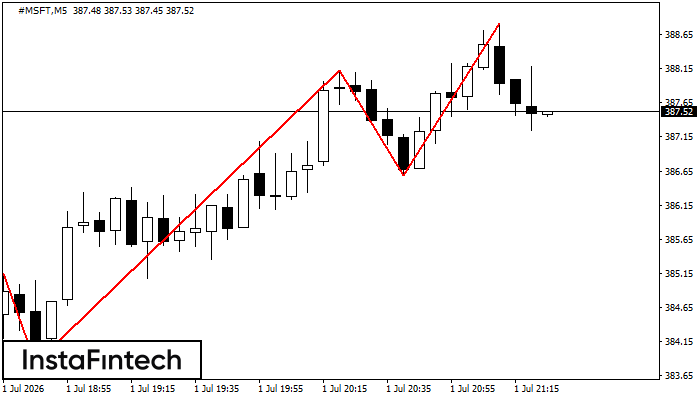
Triple Top
On the chart of the #MSFT M5 trading instrument, the Triple Top pattern that signals a trend change has formed. It is possible that after formation of the third peak, the price will try to break through the resistance level 383.82, where we advise to open a trading position for sale. Take profit is the projection of the pattern’s width, which is 397 points.
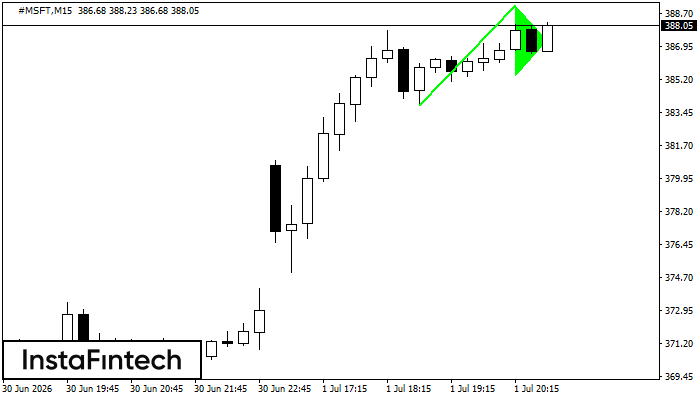
#MSFT M15
Bullish pennant
The Bullish pennant pattern is formed on the #MSFT M15 chart. It is a type of the continuation pattern. Supposedly, in case the price is fixed above the pennant’s high of 389.13, a further uptrend is possible.
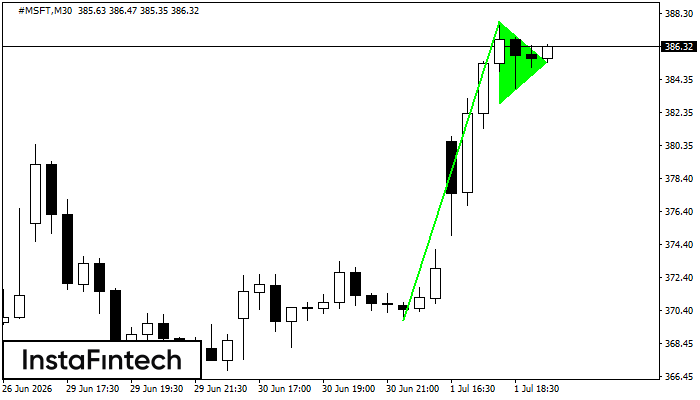
#MSFT M30
Bullish pennant
The Bullish pennant pattern is formed on the #MSFT M30 chart. It is a type of the continuation pattern. Supposedly, in case the price is fixed above the pennant’s high of 387.83, a further uptrend is possible.
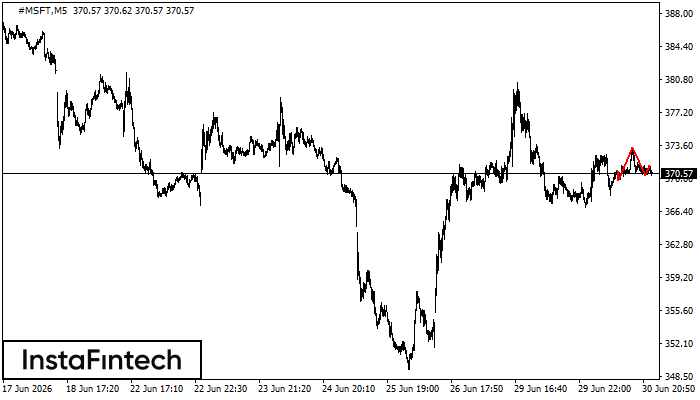
#MSFT M5
Head and Shoulders
According to the chart of M5, #MSFT formed the Head and Shoulders pattern. The Head’s top is set at 373.36 while the median line of the Neck is found at 369.82/370.31. The formation of the Head and Shoulders pattern evidently signals a reversal of the upward trend. In other words, in case the scenario comes true, the price of #MSFT will go towards 370.16.
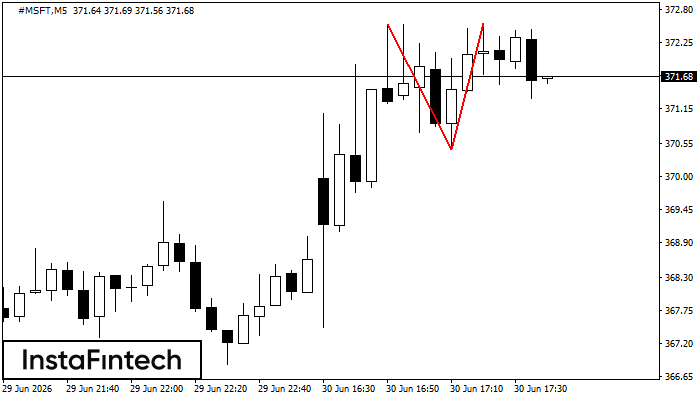
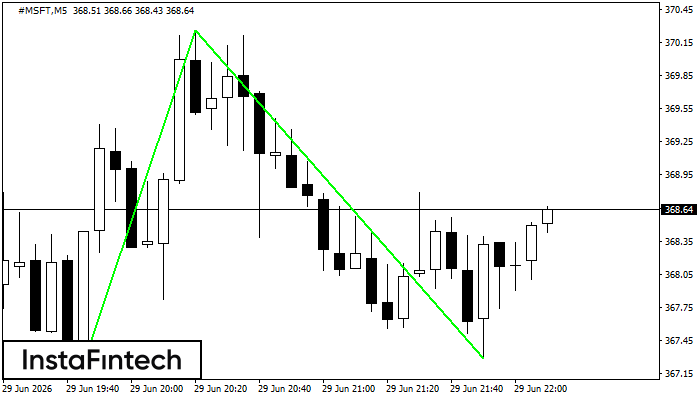
#MSFT M5
Double Top
On the chart of #MSFT M5 the Double Top reversal pattern has been formed. Characteristics: the upper boundary 372.57; the lower boundary 370.46; the width of the pattern 211 points. The signal: a break of the lower boundary will cause continuation of the downward trend targeting the 370.31 level.
#MSFT M5
Triple Bottom
The Triple Bottom pattern has formed on the chart of #MSFT M5. Features of the pattern: The lower line of the pattern has coordinates 370.26 with the upper limit 370.26/368.79, the projection of the width is 302 points. The formation of the Triple Bottom pattern most likely indicates a change in the trend from downward to upward. This means that in the event of a breakdown of the resistance level 367.24, the price is most likely to continue the upward movement.
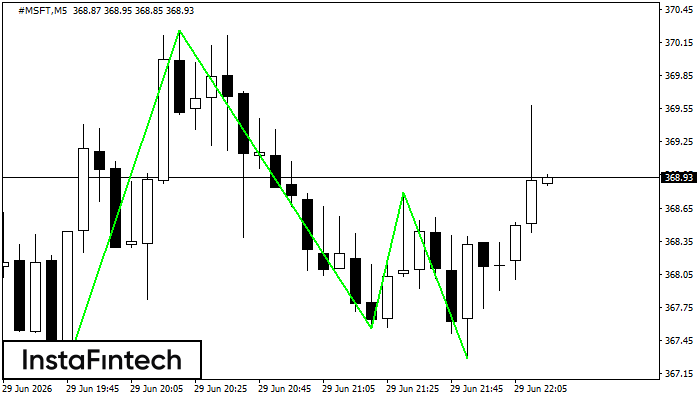
#MSFT M5
Double Bottom
The Double Bottom pattern has been formed on #MSFT M5; the upper boundary is 370.26; the lower boundary is 367.29. The width of the pattern is 302 points. In case of a break of the upper boundary 370.26, a change in the trend can be predicted where the width of the pattern will coincide with the distance to a possible take profit level.