 Română
  Русский
 English
 Bahasa Indonesia
 Bahasa Malay
 ไทย
ไทย Español
 Deutsch
 Български
 Français
 Tiếng Việt
 中文
中文 বাংলা
বাংলা हिन्दी
 Čeština
 Українська
FX.co ★ Patterns NZDCHF | New Zealand Dollar (NZD) to Swiss Franc (CHF) Rate in the Forex market

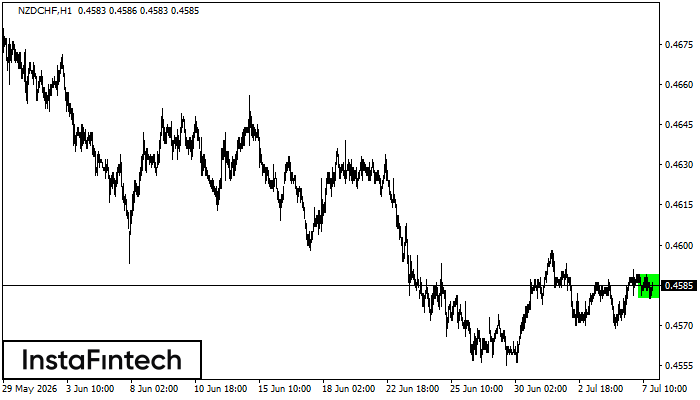
NZDCHF H1
Bullish Rectangle
According to the chart of H1, NZDCHF formed the Bullish Rectangle. The pattern indicates a trend continuation. The upper border is 0.4589, the lower border is 0.4580. The signal means that a long position should be opened above the upper border 0.4589 of the Bullish Rectangle.
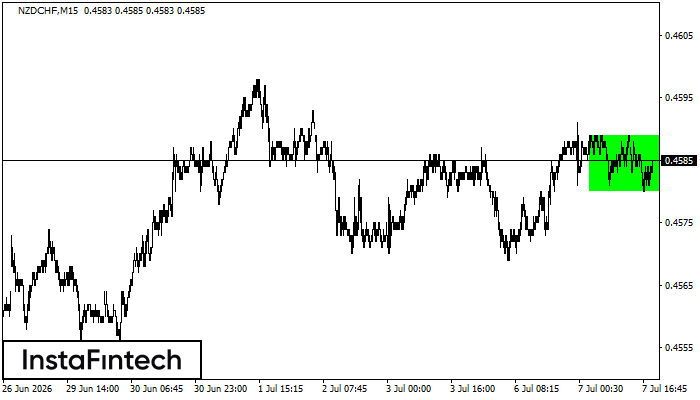
NZDCHF M15
Bullish Rectangle
According to the chart of M15, NZDCHF formed the Bullish Rectangle which is a pattern of a trend continuation. The pattern is contained within the following borders: the lower border 0.4580 – 0.4580 and upper border 0.4589 – 0.4589. In case the upper border is broken, the instrument is likely to follow the upward trend.
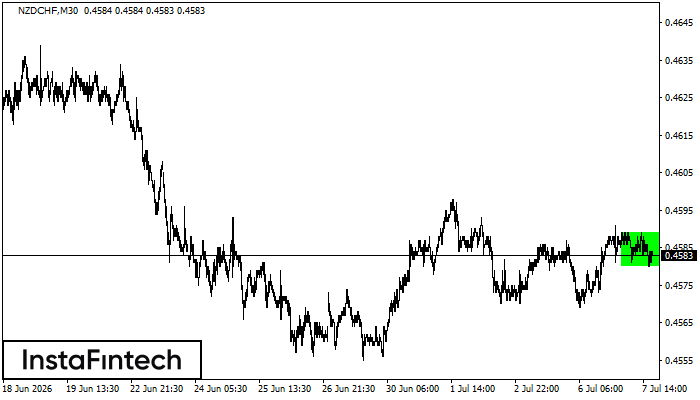
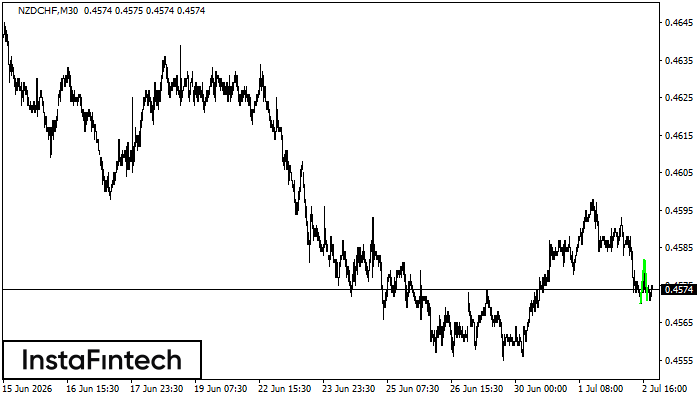
NZDCHF M30
Bullish Rectangle
According to the chart of M30, NZDCHF formed the Bullish Rectangle. The pattern indicates a trend continuation. The upper border is 0.4589, the lower border is 0.4580. The signal means that a long position should be opened above the upper border 0.4589 of the Bullish Rectangle.
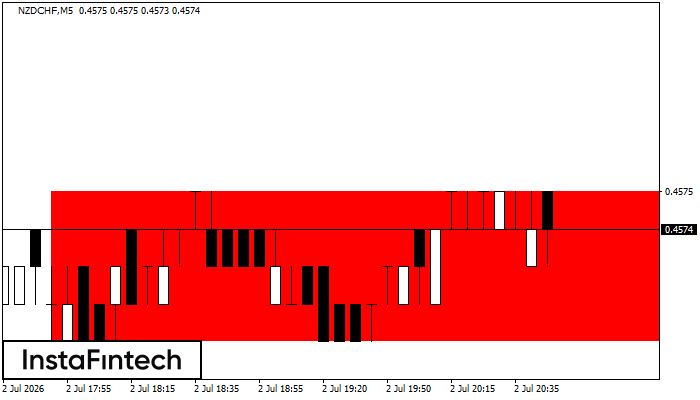
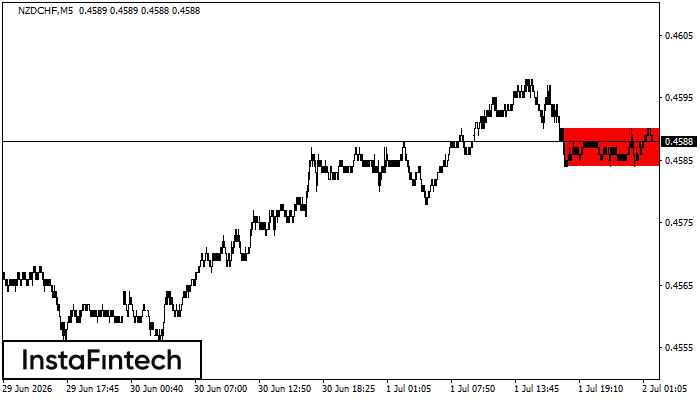
NZDCHF M5
Bearish Rectangle
According to the chart of M5, NZDCHF formed the Bearish Rectangle. This type of a pattern indicates a trend continuation. It consists of two levels: resistance 0.4575 - 0.0000 and support 0.4571 – 0.4571. In case the resistance level 0.4571 - 0.4571 is broken, the instrument is likely to follow the bearish trend.
NZDCHF M30
Double Bottom
The Double Bottom pattern has been formed on NZDCHF M30. This formation signals a reversal of the trend from downwards to upwards. The signal is that a buy trade should be opened after the upper boundary of the pattern 0.4582 is broken. The further movements will rely on the width of the current pattern 12 points.
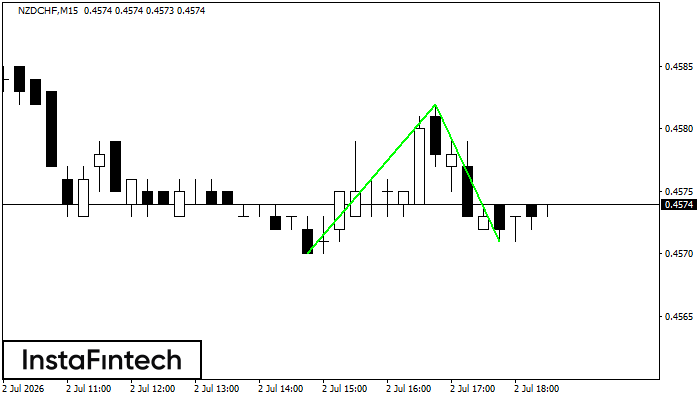
NZDCHF M15
Double Bottom
The Double Bottom pattern has been formed on NZDCHF M15. This formation signals a reversal of the trend from downwards to upwards. The signal is that a buy trade should be opened after the upper boundary of the pattern 0.4582 is broken. The further movements will rely on the width of the current pattern 12 points.
NZDCHF M5
Bearish Rectangle
According to the chart of M5, NZDCHF formed the Bearish Rectangle which is a pattern of a trend continuation. The pattern is contained within the following borders: lower border 0.4584 – 0.4584 and upper border 0.4590 – 0.4590. In case the lower border is broken, the instrument is likely to follow the downward trend.
NZDCHF H1
Double Top
On the chart of NZDCHF H1 the Double Top reversal pattern has been formed. Characteristics: the upper boundary 0.4588; the lower boundary 0.4580; the width of the pattern 8 points. The signal: a break of the lower boundary will cause continuation of the downward trend targeting the 0.4540 level.
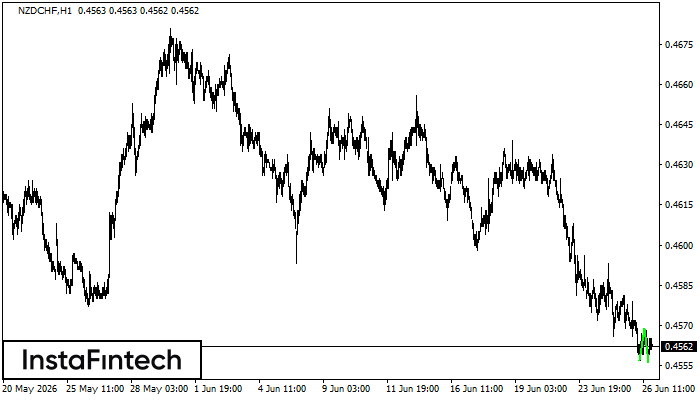
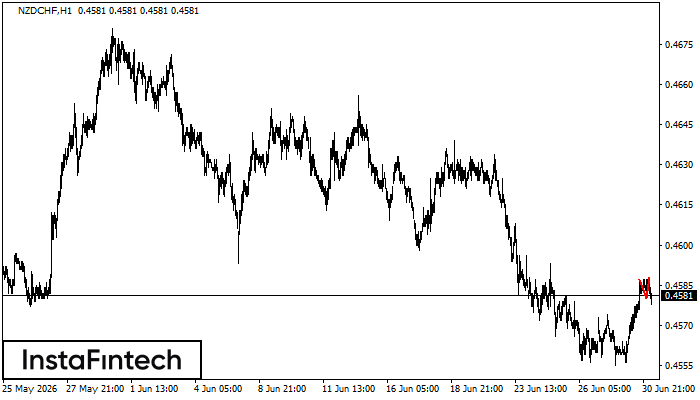
NZDCHF H1
Double Bottom
The Double Bottom pattern has been formed on NZDCHF H1. This formation signals a reversal of the trend from downwards to upwards. The signal is that a buy trade should be opened after the upper boundary of the pattern 0.4569 is broken. The further movements will rely on the width of the current pattern 12 points.
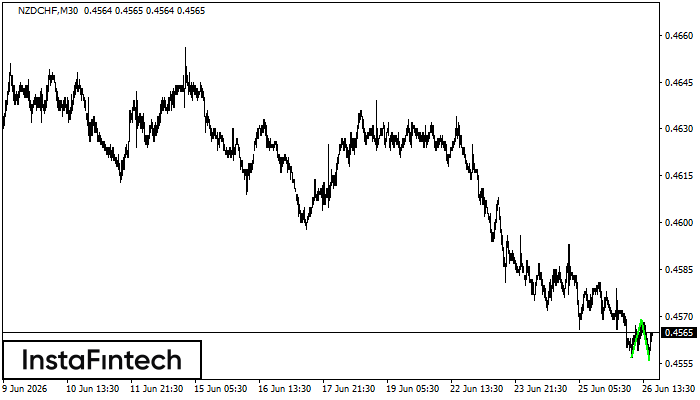
NZDCHF M30
Double Bottom
The Double Bottom pattern has been formed on NZDCHF M30; the upper boundary is 0.4569; the lower boundary is 0.4556. The width of the pattern is 12 points. In case of a break of the upper boundary 0.4569, a change in the trend can be predicted where the width of the pattern will coincide with the distance to a possible take profit level.