 Română
  Русский
 English
 Bahasa Indonesia
 Bahasa Malay
 ไทย
ไทย Español
 Deutsch
 Български
 Français
 Tiếng Việt
 中文
中文 বাংলা
বাংলা हिन्दी
 Čeština
 Українська
FX.co ★ Patterns NZDJPY | New Zealand Dollar (NZD) to Japanese Yen (JPY) Rate in the Forex market

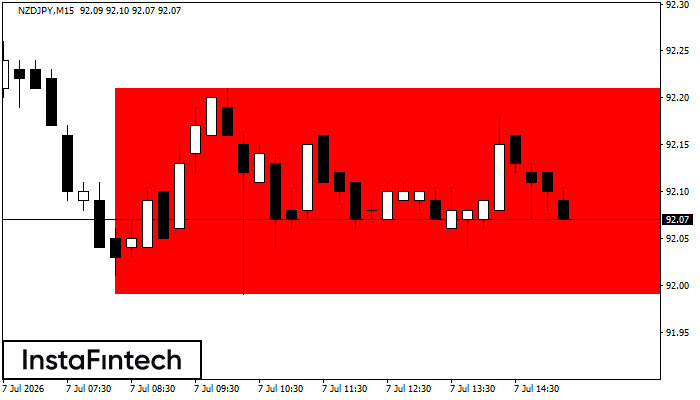
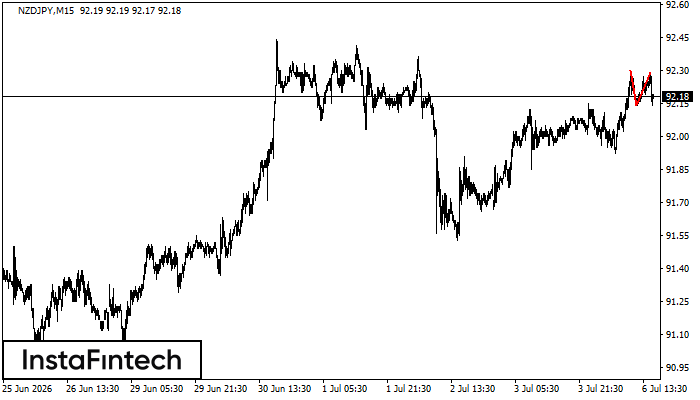
NZDJPY M15
Bearish Rectangle
According to the chart of M15, NZDJPY formed the Bearish Rectangle. This type of a pattern indicates a trend continuation. It consists of two levels: resistance 92.21 - 0.00 and support 91.99 – 91.99. In case the resistance level 91.99 - 91.99 is broken, the instrument is likely to follow the bearish trend.
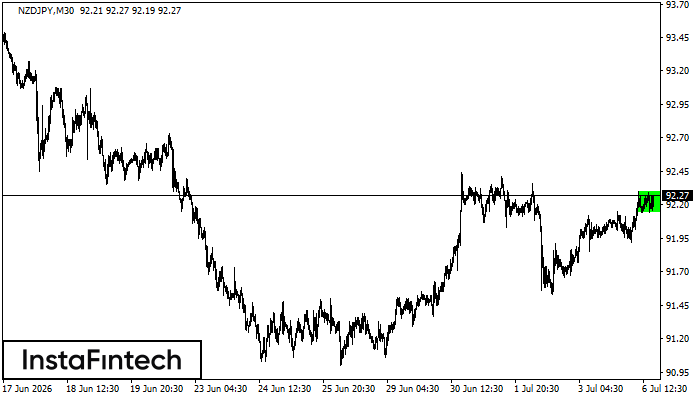
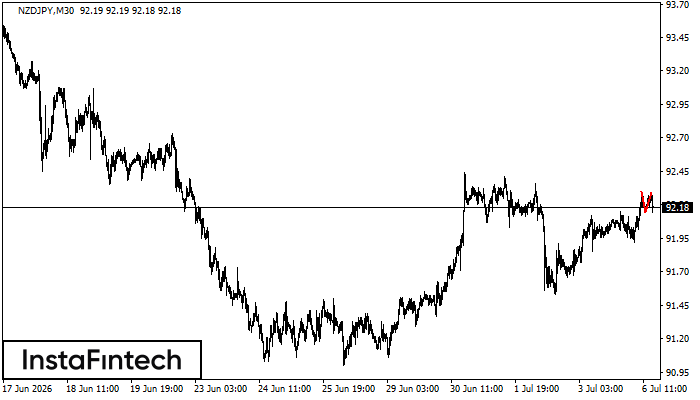
NZDJPY M30
Bullish Rectangle
According to the chart of M30, NZDJPY formed the Bullish Rectangle. The pattern indicates a trend continuation. The upper border is 92.30, the lower border is 92.14. The signal means that a long position should be opened above the upper border 92.30 of the Bullish Rectangle.
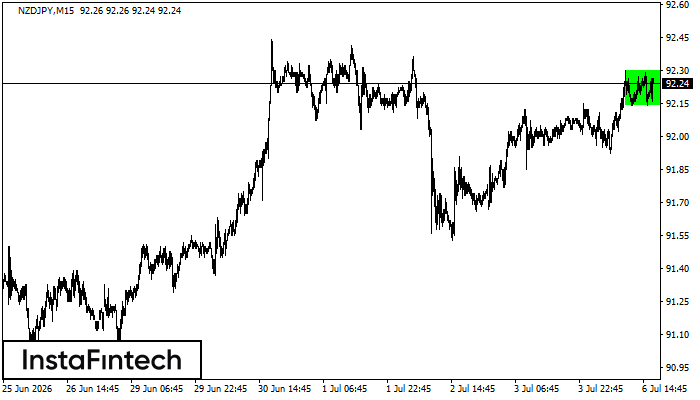
NZDJPY M15
Bullish Rectangle
According to the chart of M15, NZDJPY formed the Bullish Rectangle. The pattern indicates a trend continuation. The upper border is 92.30, the lower border is 92.14. The signal means that a long position should be opened above the upper border 92.30 of the Bullish Rectangle.
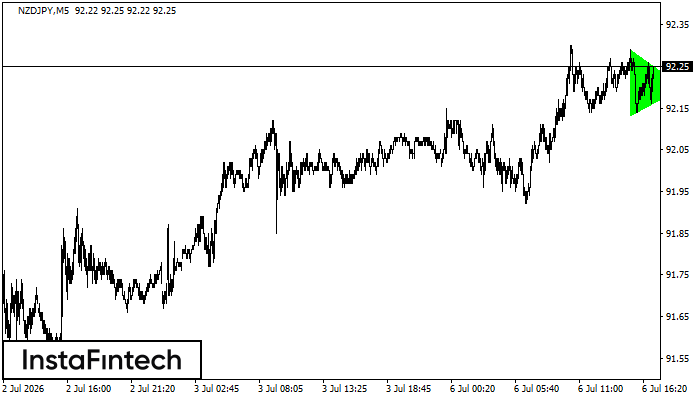
NZDJPY M5
Bullish Symmetrical Triangle
According to the chart of M5, NZDJPY formed the Bullish Symmetrical Triangle pattern, which signals the trend will continue. Description. The upper border of the pattern touches the coordinates 92.29/92.20 whereas the lower border goes across 92.13/92.20. The pattern width is measured on the chart at 16 pips. If the Bullish Symmetrical Triangle pattern is in progress during the upward trend, this indicates the current trend will go on. In case 92.20 is broken, the price could continue its move toward 92.35.
NZDJPY M15
Double Top
The Double Top reversal pattern has been formed on NZDJPY M15. Characteristics: the upper boundary 92.30; the lower boundary 92.14; the width of the pattern is 15 points. Sell trades are better to be opened below the lower boundary 92.14 with a possible movements towards the 91.92 level.
NZDJPY M30
Double Top
The Double Top reversal pattern has been formed on NZDJPY M30. Characteristics: the upper boundary 92.30; the lower boundary 92.14; the width of the pattern is 15 points. Sell trades are better to be opened below the lower boundary 92.14 with a possible movements towards the 91.84 level.
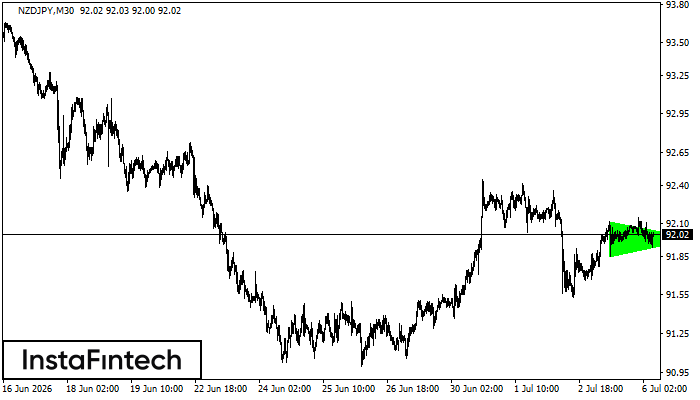
NZDJPY M30
Bullish Symmetrical Triangle
According to the chart of M30, NZDJPY formed the Bullish Symmetrical Triangle pattern. The lower border of the pattern touches the coordinates 91.85/91.99 whereas the upper border goes across 92.12/91.99. If the Bullish Symmetrical Triangle pattern is in progress, this evidently signals a further upward trend. In other words, in case the scenario comes true, the price of NZDJPY will breach the upper border to head for 92.29.
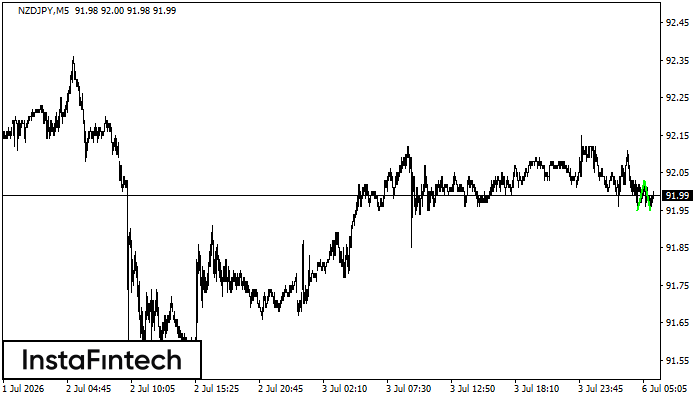
NZDJPY M5
Double Bottom
The Double Bottom pattern has been formed on NZDJPY M5. This formation signals a reversal of the trend from downwards to upwards. The signal is that a buy trade should be opened after the upper boundary of the pattern 92.03 is broken. The further movements will rely on the width of the current pattern 8 points.
NZDJPY M5
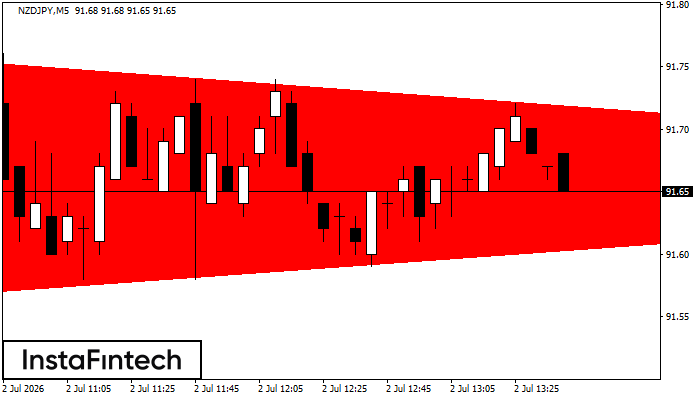
Bearish Symmetrical Triangle
According to the chart of M5, NZDJPY formed the Bearish Symmetrical Triangle pattern. Trading recommendations: A breach of the lower border 91.56 is likely to encourage a continuation of the downward trend.
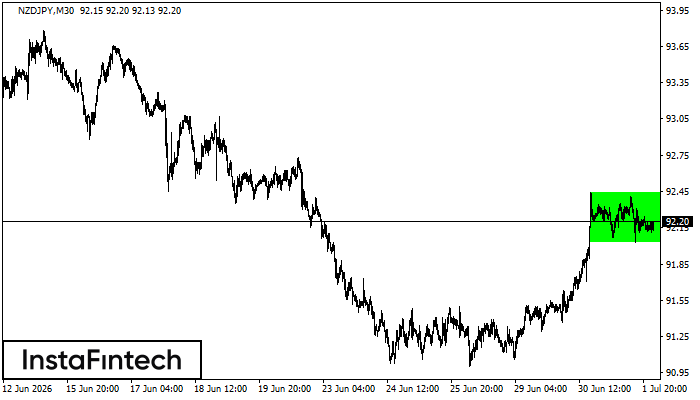
NZDJPY M30
Bullish Rectangle
According to the chart of M30, NZDJPY formed the Bullish Rectangle. The pattern indicates a trend continuation. The upper border is 92.44, the lower border is 92.03. The signal means that a long position should be opened above the upper border 92.44 of the Bullish Rectangle.