 Română
  Русский
 English
 Bahasa Indonesia
 Bahasa Malay
 ไทย
ไทย Español
 Deutsch
 Български
 Français
 Tiếng Việt
 中文
中文 বাংলা
বাংলা हिन्दी
 Čeština
 Українська
FX.co ★ Patterns NZDUSD | New Zealand Dollar (NZD) to US Dollar (USD) Rate in the Forex market

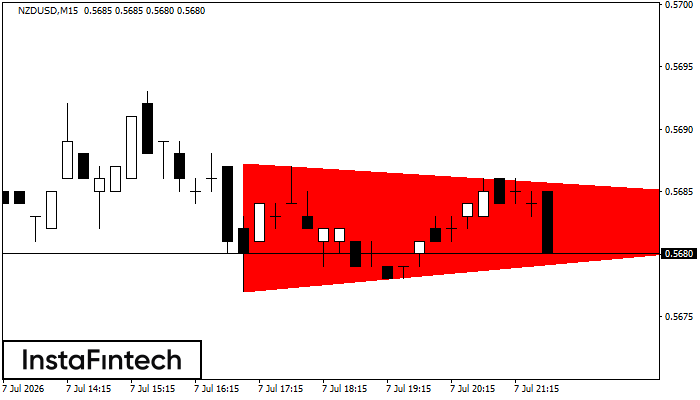
NZDUSD M15
Bearish Symmetrical Triangle
According to the chart of M15, NZDUSD formed the Bearish Symmetrical Triangle pattern. Trading recommendations: A breach of the lower border 0.5677 is likely to encourage a continuation of the downward trend.
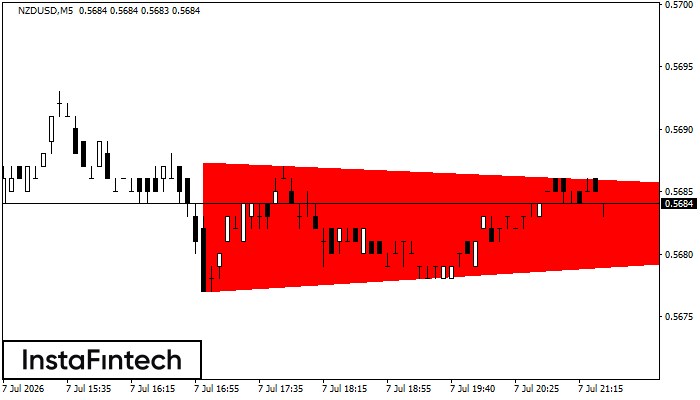
NZDUSD M5
Bearish Symmetrical Triangle
According to the chart of M5, NZDUSD formed the Bearish Symmetrical Triangle pattern. Trading recommendations: A breach of the lower border 0.5677 is likely to encourage a continuation of the downward trend.
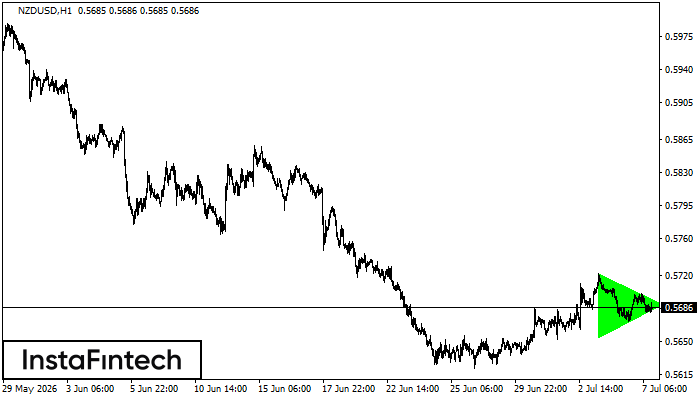
NZDUSD H1
Bullish Symmetrical Triangle
According to the chart of H1, NZDUSD formed the Bullish Symmetrical Triangle pattern. Description: This is the pattern of a trend continuation. 0.5722 and 0.5654 are the coordinates of the upper and lower borders respectively. The pattern width is measured on the chart at 68 pips. Outlook: If the upper border 0.5722 is broken, the price is likely to continue its move by 0.5730.
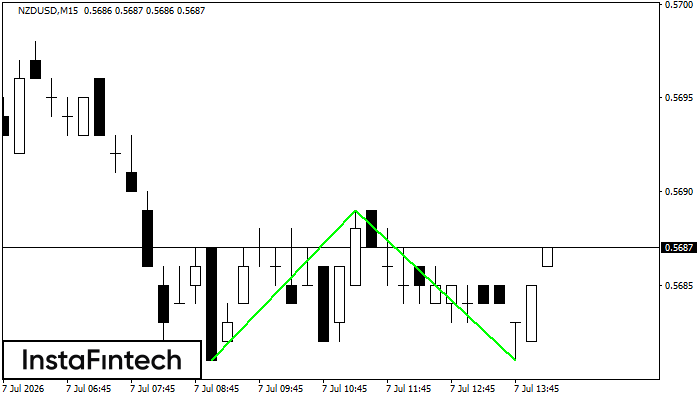
NZDUSD M15
Double Bottom
The Double Bottom pattern has been formed on NZDUSD M15. This formation signals a reversal of the trend from downwards to upwards. The signal is that a buy trade should be opened after the upper boundary of the pattern 0.5689 is broken. The further movements will rely on the width of the current pattern 8 points.
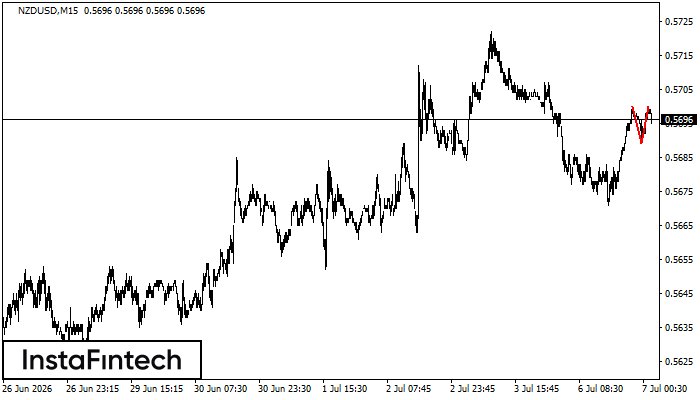
NZDUSD M15
Double Top
The Double Top reversal pattern has been formed on NZDUSD M15. Characteristics: the upper boundary 0.5700; the lower boundary 0.5689; the width of the pattern is 11 points. Sell trades are better to be opened below the lower boundary 0.5689 with a possible movements towards the 0.5666 level.
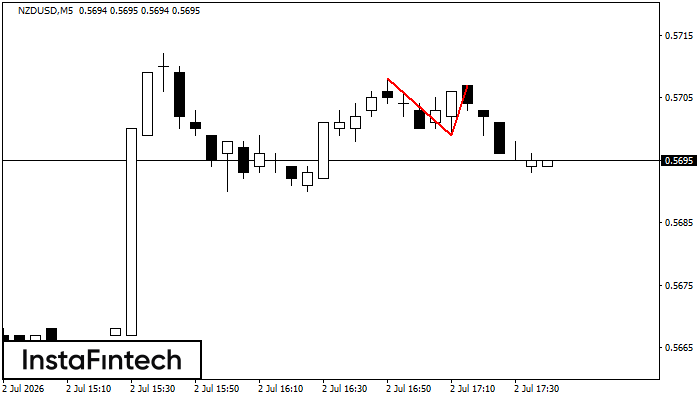
NZDUSD M5
Double Top
The Double Top reversal pattern has been formed on NZDUSD M5. Characteristics: the upper boundary 0.5708; the lower boundary 0.5699; the width of the pattern is 8 points. Sell trades are better to be opened below the lower boundary 0.5699 with a possible movements towards the 0.5684 level.
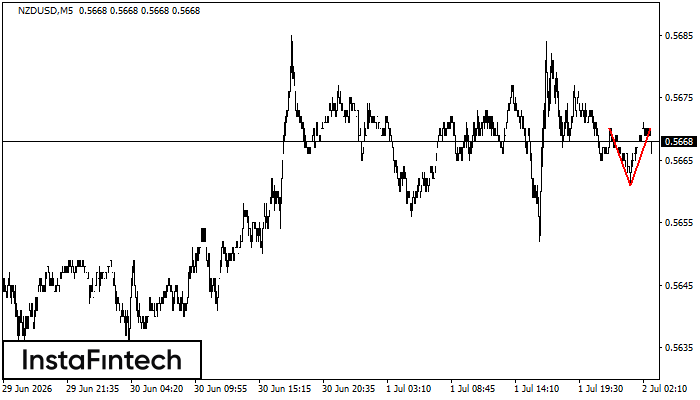
NZDUSD M5
Double Top
The Double Top reversal pattern has been formed on NZDUSD M5. Characteristics: the upper boundary 0.5670; the lower boundary 0.5661; the width of the pattern is 9 points. Sell trades are better to be opened below the lower boundary 0.5661 with a possible movements towards the 0.5646 level.
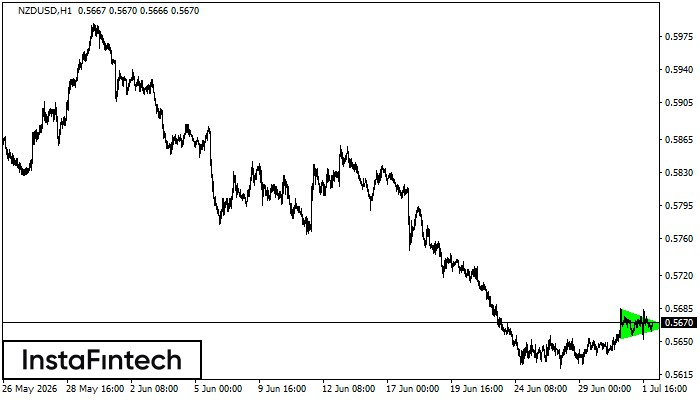
NZDUSD H1
Bullish Symmetrical Triangle
According to the chart of H1, NZDUSD formed the Bullish Symmetrical Triangle pattern, which signals the trend will continue. Description. The upper border of the pattern touches the coordinates 0.5685/0.5666 whereas the lower border goes across 0.5653/0.5666. The pattern width is measured on the chart at 32 pips. If the Bullish Symmetrical Triangle pattern is in progress during the upward trend, this indicates the current trend will go on. In case 0.5666 is broken, the price could continue its move toward 0.5706.
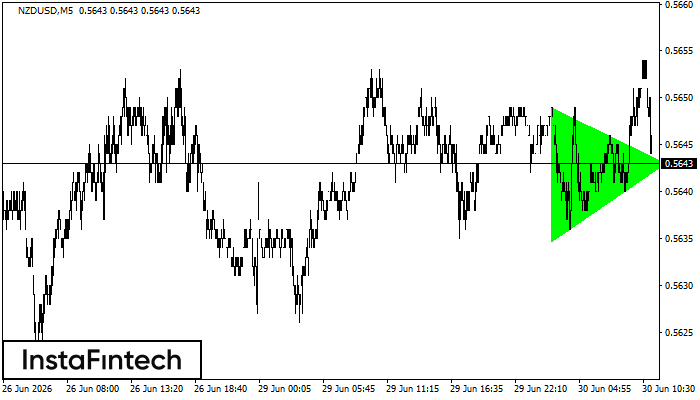
NZDUSD M5
Bullish Symmetrical Triangle
According to the chart of M5, NZDUSD formed the Bullish Symmetrical Triangle pattern. Description: This is the pattern of a trend continuation. 0.5649 and 0.5635 are the coordinates of the upper and lower borders respectively. The pattern width is measured on the chart at 14 pips. Outlook: If the upper border 0.5649 is broken, the price is likely to continue its move by 0.5658.
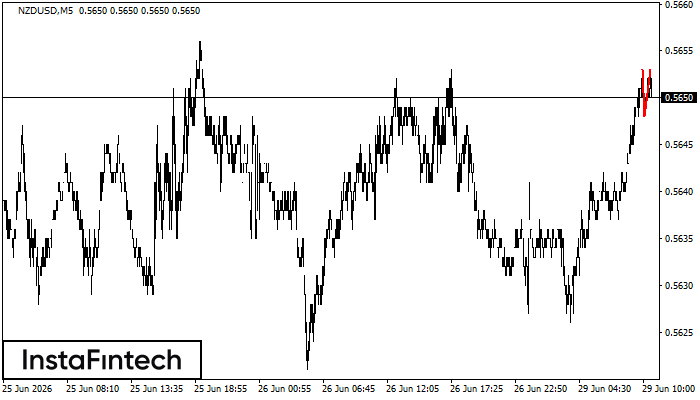
NZDUSD M5
Double Top
The Double Top reversal pattern has been formed on NZDUSD M5. Characteristics: the upper boundary 0.5653; the lower boundary 0.5648; the width of the pattern is 5 points. Sell trades are better to be opened below the lower boundary 0.5648 with a possible movements towards the 0.5633 level.