 Română
  Русский
 English
 Bahasa Indonesia
 Bahasa Malay
 ไทย
ไทย Español
 Deutsch
 Български
 Français
 Tiếng Việt
 中文
中文 বাংলা
বাংলা हिन्दी
 Čeština
 Українська
FX.co ★ Patterns USDCHF | US Dollar (USD) to Swiss Franc (CHF) Rate in the Forex market

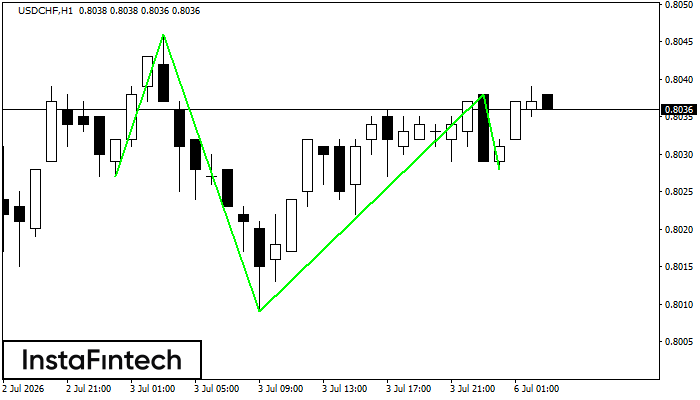
USDCHF H1
Inverse Head and Shoulder
According to the chart of H1, USDCHF produced the pattern termed the Inverse Head and Shoulder. The Head is fixed at 0.8009 while the median line of the Neck is set at 0.8046/0.8038. The formation of the Inverse Head and Shoulder Pattern clearly indicates a reversal of the downward trend. In means that in case the scenario comes true, the price of USDCHF will go towards 0.8078.
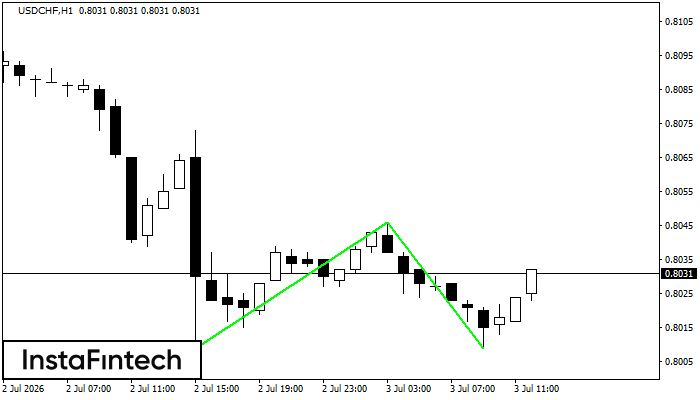
USDCHF H1
Double Bottom
The Double Bottom pattern has been formed on USDCHF H1. Characteristics: the support level 0.8009; the resistance level 0.8046; the width of the pattern 37 points. If the resistance level is broken, a change in the trend can be predicted with the first target point lying at the distance of 37 points.
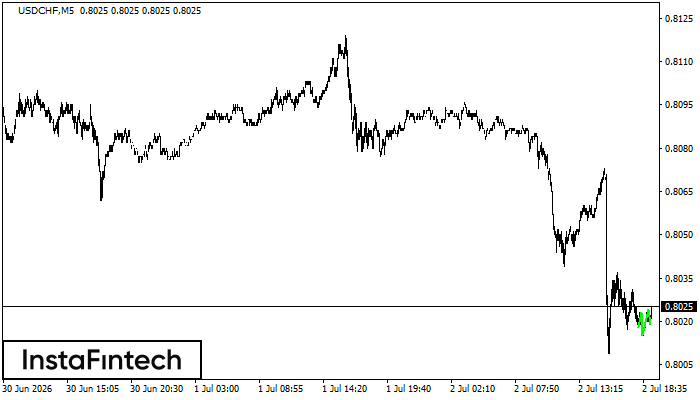
USDCHF M5
Inverse Head and Shoulder
According to M5, USDCHF is shaping the technical pattern – the Inverse Head and Shoulder. In case the Neckline 0.8023/0.8024 is broken out, the instrument is likely to move toward 0.8039.
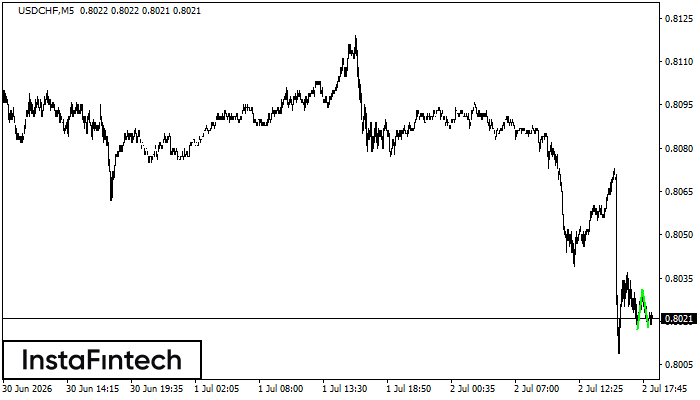
USDCHF M5
Double Bottom
The Double Bottom pattern has been formed on USDCHF M5. This formation signals a reversal of the trend from downwards to upwards. The signal is that a buy trade should be opened after the upper boundary of the pattern 0.8031 is broken. The further movements will rely on the width of the current pattern 14 points.
USDCHF M5
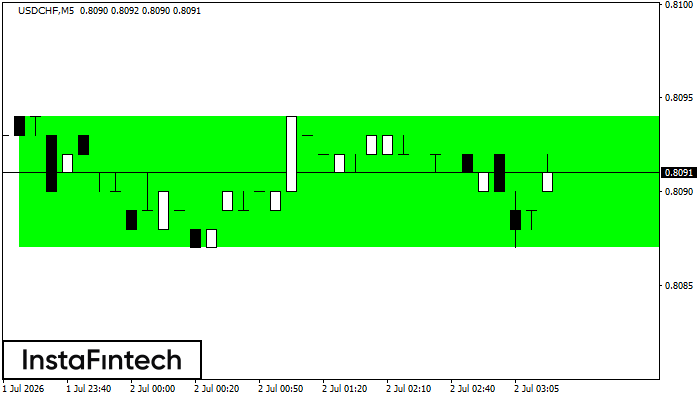
Bullish Rectangle
According to the chart of M5, USDCHF formed the Bullish Rectangle which is a pattern of a trend continuation. The pattern is contained within the following borders: the lower border 0.8087 – 0.8087 and upper border 0.8094 – 0.8094. In case the upper border is broken, the instrument is likely to follow the upward trend.
USDCHF M5
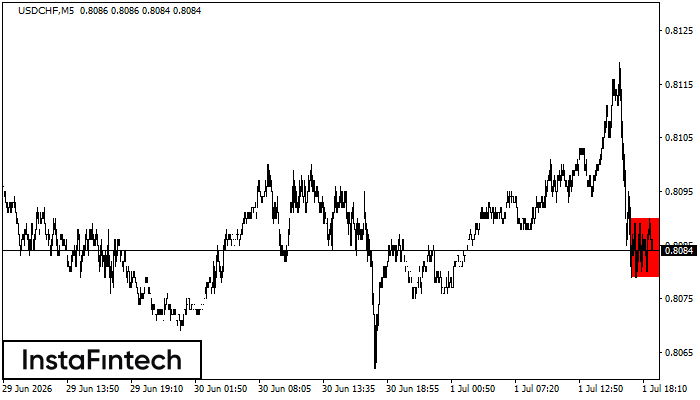
Bearish Rectangle
According to the chart of M5, USDCHF formed the Bearish Rectangle. This type of a pattern indicates a trend continuation. It consists of two levels: resistance 0.8090 - 0.0000 and support 0.8079 – 0.8079. In case the resistance level 0.8079 - 0.8079 is broken, the instrument is likely to follow the bearish trend.
USDCHF M15
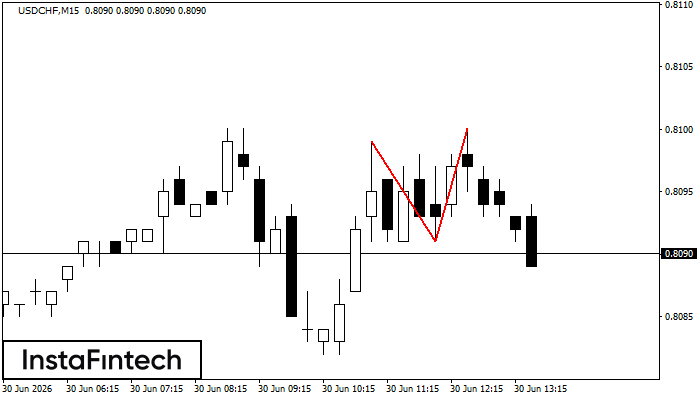
Double Top
The Double Top pattern has been formed on USDCHF M15. It signals that the trend has been changed from upwards to downwards. Probably, if the base of the pattern 0.8091 is broken, the downward movement will continue.
USDCHF M5
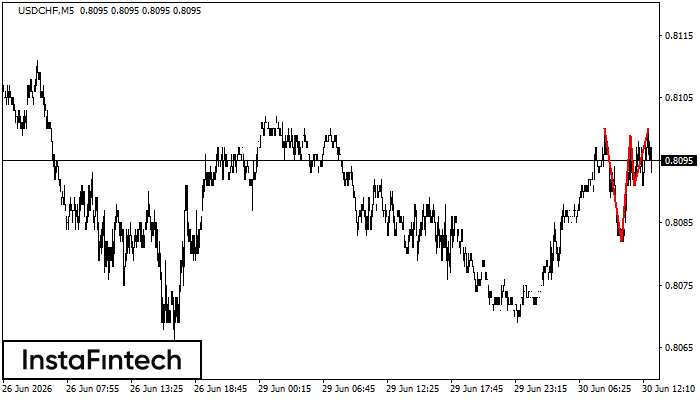
Triple Top
On the chart of the USDCHF M5 trading instrument, the Triple Top pattern that signals a trend change has formed. It is possible that after formation of the third peak, the price will try to break through the resistance level 0.8082, where we advise to open a trading position for sale. Take profit is the projection of the pattern’s width, which is 18 points.
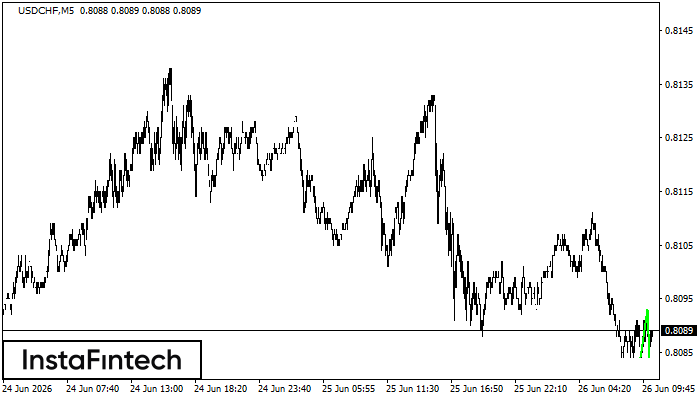
USDCHF M5
Double Bottom
The Double Bottom pattern has been formed on USDCHF M5. Characteristics: the support level 0.8068; the resistance level 0.8079; the width of the pattern 11 points. If the resistance level is broken, a change in the trend can be predicted with the first target point lying at the distance of 10 points.
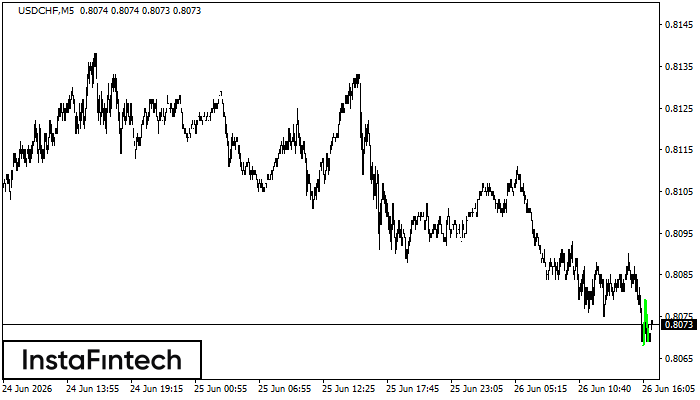
USDCHF M5
Double Bottom
The Double Bottom pattern has been formed on USDCHF M5; the upper boundary is 0.8093; the lower boundary is 0.8084. The width of the pattern is 9 points. In case of a break of the upper boundary 0.8093, a change in the trend can be predicted where the width of the pattern will coincide with the distance to a possible take profit level.