 中文
中文  Русский
 English
 Bahasa Indonesia
 Bahasa Malay
 ไทย
ไทย Español
 Deutsch
 Български
 Français
 Tiếng Việt
 বাংলা
বাংলা हिन्दी
 Čeština
 Українська
 Română
FX.co ★ Patterns AUDCAD | Australian Dollar (AUD) to Canadian Dollar (CAD) Rate in the Forex market

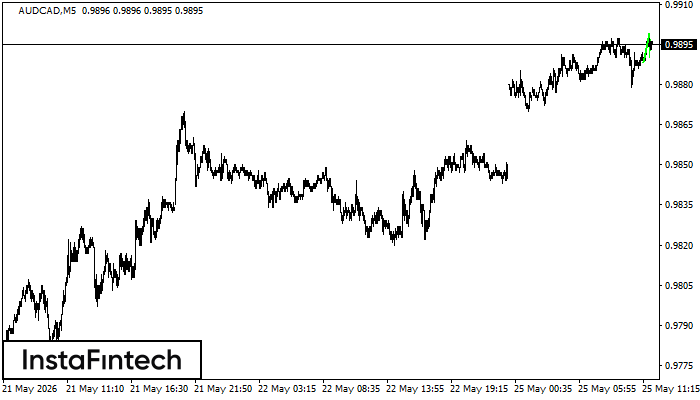
AUDCAD M5
Bullish pennant
The Bullish pennant pattern is formed on the AUDCAD M5 chart. It is a type of the continuation pattern. Supposedly, in case the price is fixed above the pennant’s high of 0.9899, a further uptrend is possible.

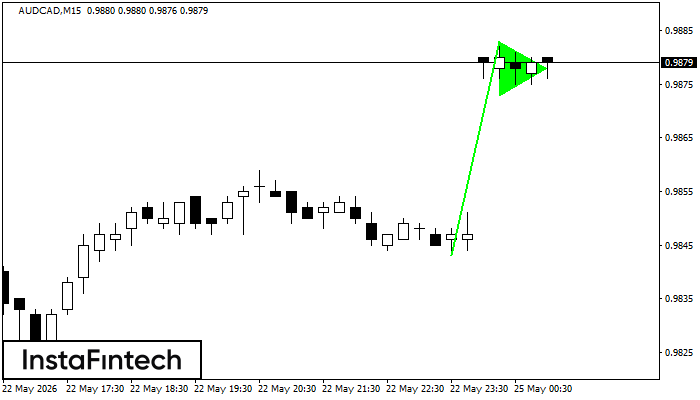
AUDCAD M15
Bullish pennant
The Bullish pennant graphic pattern has formed on the AUDCAD M15 instrument. This pattern type falls under the category of continuation patterns. In this case, if the quote can breaks out high, is expected to continue the upward trend to level 0.9908.
AUDCAD M15
Bullish pennant
The Bullish pennant pattern is formed on the AUDCAD M15 chart. It is a type of the continuation pattern. Supposedly, in case the price is fixed above the pennant’s high of 0.9883, a further uptrend is possible.
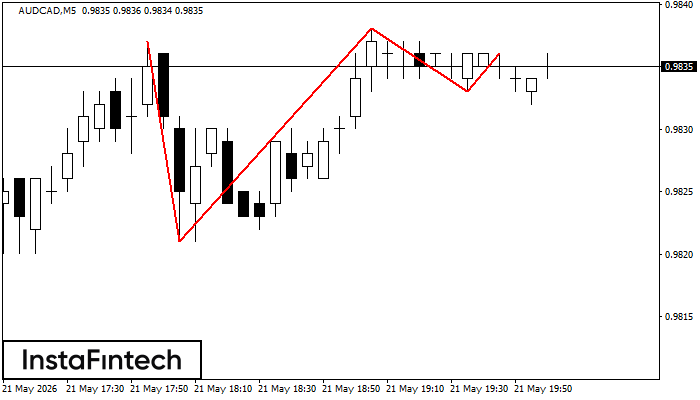
AUDCAD M5
Triple Top
On the chart of the AUDCAD M5 trading instrument, the Triple Top pattern that signals a trend change has formed. It is possible that after formation of the third peak, the price will try to break through the resistance level 0.9821, where we advise to open a trading position for sale. Take profit is the projection of the pattern’s width, which is 16 points.
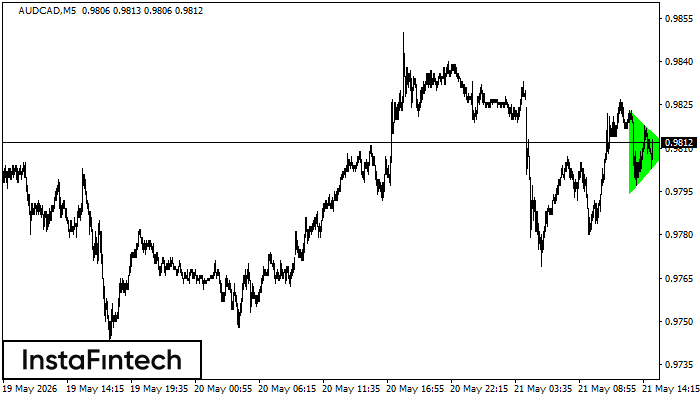
AUDCAD M5
Bullish Symmetrical Triangle
According to the chart of M5, AUDCAD formed the Bullish Symmetrical Triangle pattern. Description: This is the pattern of a trend continuation. 0.9823 and 0.9794 are the coordinates of the upper and lower borders respectively. The pattern width is measured on the chart at 29 pips. Outlook: If the upper border 0.9823 is broken, the price is likely to continue its move by 0.9825.
AUDCAD M30
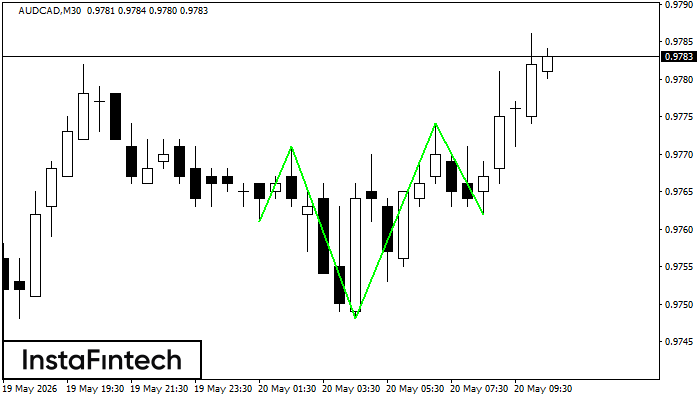
Inverse Head and Shoulder
According to the chart of M30, AUDCAD produced the pattern termed the Inverse Head and Shoulder. The Head is fixed at 0.9748 while the median line of the Neck is set at 0.9771/0.9774. The formation of the Inverse Head and Shoulder Pattern clearly indicates a reversal of the downward trend. In means that in case the scenario comes true, the price of AUDCAD will go towards 0.9804.
AUDCAD M30
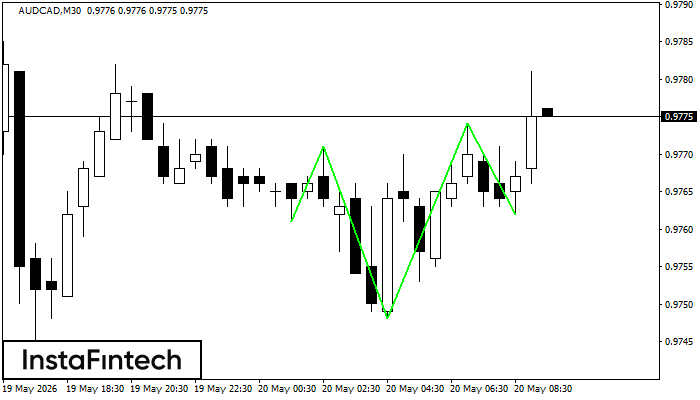
Inverse Head and Shoulder
According to the chart of M30, AUDCAD formed the Inverse Head and Shoulder pattern. The Head’s top is set at 0.9774 while the median line of the Neck is found at 0.9748/0.9762. The formation of the Inverse Head and Shoulder pattern evidently signals a reversal of the downward trend. In other words, in case the scenario comes true, the price of AUDCAD will go towards 0.9804
AUDCAD M5
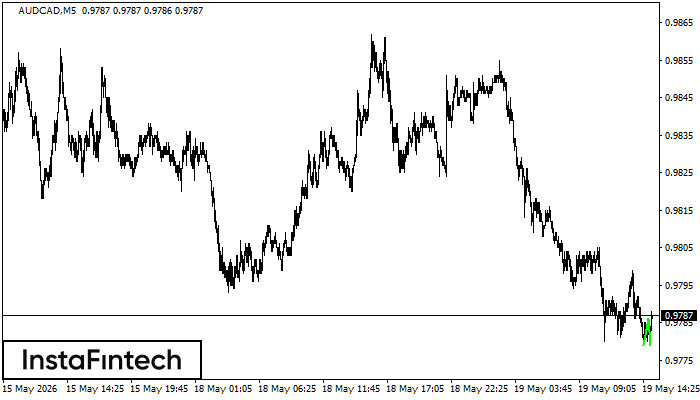
Double Bottom
The Double Bottom pattern has been formed on AUDCAD M5. Characteristics: the support level 0.9779; the resistance level 0.9786; the width of the pattern 7 points. If the resistance level is broken, a change in the trend can be predicted with the first target point lying at the distance of 7 points.
AUDCAD M5
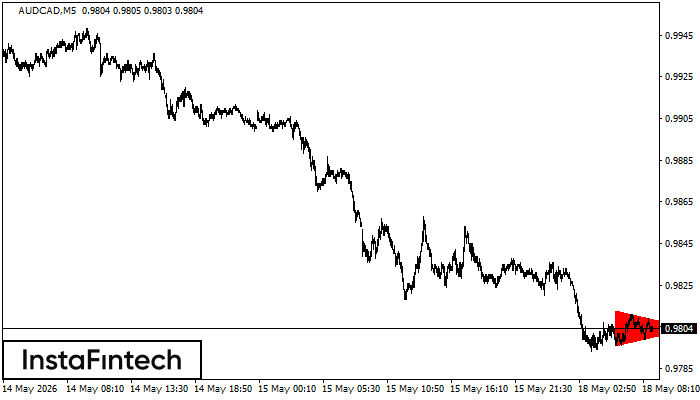
Bearish Symmetrical Triangle
According to the chart of M5, AUDCAD formed the Bearish Symmetrical Triangle pattern. Description: The lower border is 0.9796/0.9804 and upper border is 0.9813/0.9804. The pattern width is measured on the chart at -17 pips. The formation of the Bearish Symmetrical Triangle pattern evidently signals a continuation of the downward trend. In other words, if the scenario comes true and AUDCAD breaches the lower border, the price could continue its move toward 0.9789.
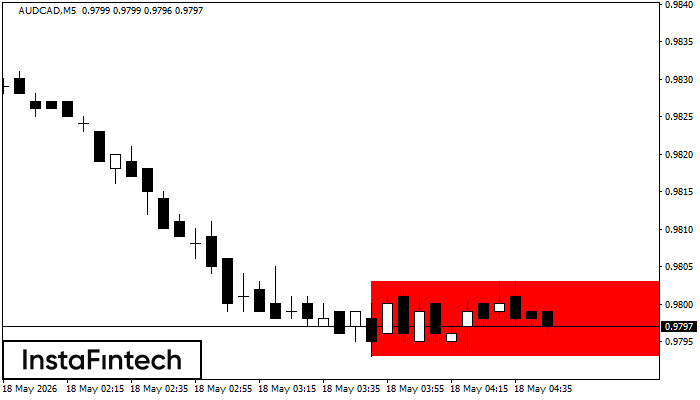
AUDCAD M5
Bearish Rectangle
According to the chart of M5, AUDCAD formed the Bearish Rectangle. This type of a pattern indicates a trend continuation. It consists of two levels: resistance 0.9803 - 0.0000 and support 0.9793 – 0.9793. In case the resistance level 0.9793 - 0.9793 is broken, the instrument is likely to follow the bearish trend.