 中文
中文  Русский
 English
 Bahasa Indonesia
 Bahasa Malay
 ไทย
ไทย Español
 Deutsch
 Български
 Français
 Tiếng Việt
 বাংলা
বাংলা हिन्दी
 Čeština
 Українська
 Română
FX.co ★ Patterns AUDUSD | Australian Dollar (AUD) to US Dollar (USD) Rate in the Forex market

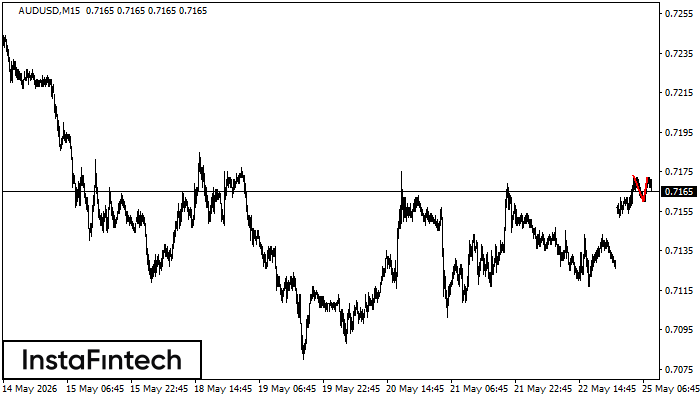
AUDUSD M15
Double Top
The Double Top pattern has been formed on AUDUSD M15. It signals that the trend has been changed from upwards to downwards. Probably, if the base of the pattern 0.7160 is broken, the downward movement will continue.
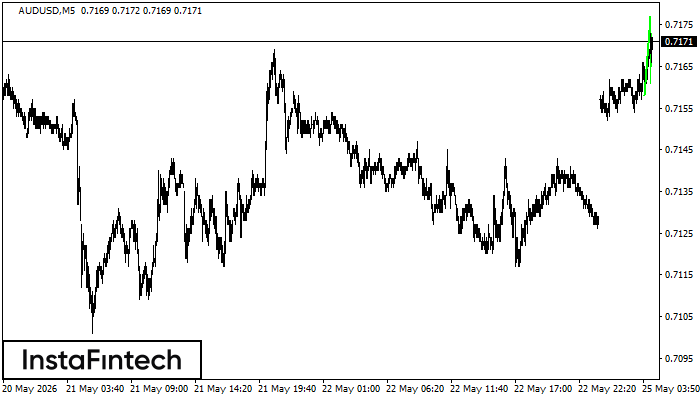
AUDUSD M5
Bullish pennant
The Bullish pennant graphic pattern has formed on the AUDUSD M5 instrument. This pattern type falls under the category of continuation patterns. In this case, if the quote can breaks out high, is expected to continue the upward trend to level 0.7192.
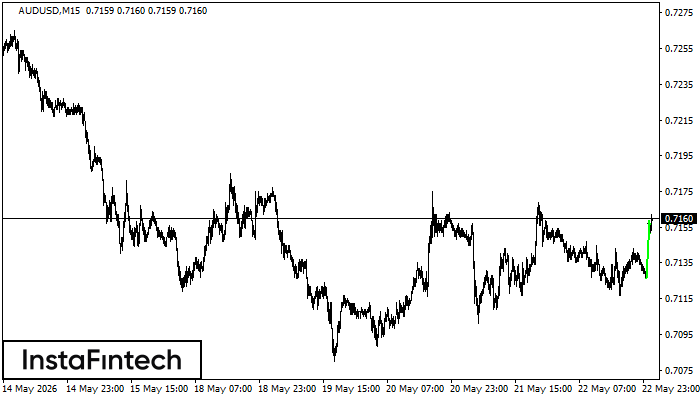
AUDUSD M15
Bullish pennant
The Bullish pennant pattern is formed on the AUDUSD M15 chart. It is a type of the continuation pattern. Supposedly, in case the price is fixed above the pennant’s high of 0.7159, a further uptrend is possible.
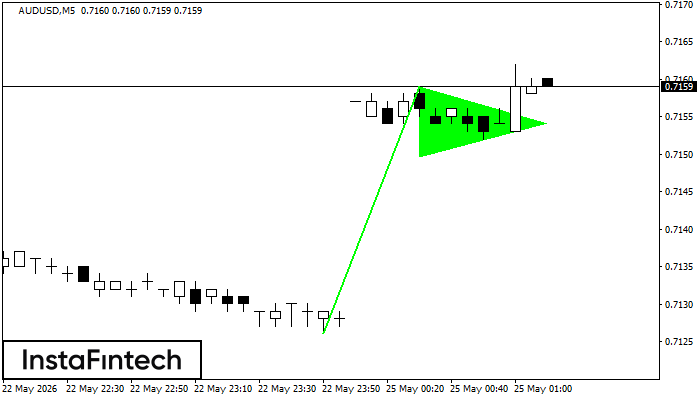
AUDUSD M5
Bullish pennant
The Bullish pennant graphic pattern has formed on the AUDUSD M5 instrument. This pattern type falls under the category of continuation patterns. In this case, if the quote can breaks out high, is expected to continue the upward trend to level 0.7174.
AUDUSD M5
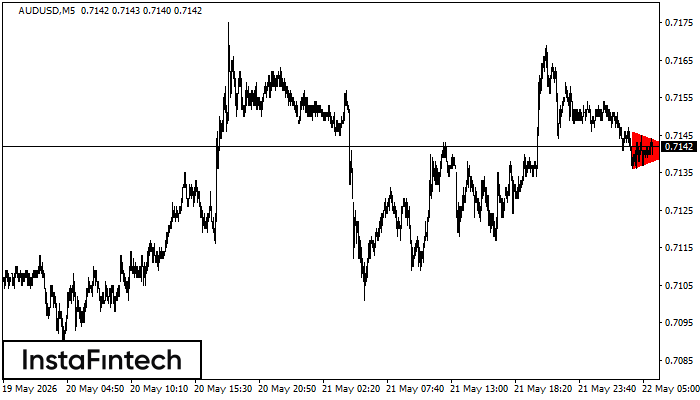
Bearish Symmetrical Triangle
According to the chart of M5, AUDUSD formed the Bearish Symmetrical Triangle pattern. Description: The lower border is 0.7136/0.7141 and upper border is 0.7146/0.7141. The pattern width is measured on the chart at -10 pips. The formation of the Bearish Symmetrical Triangle pattern evidently signals a continuation of the downward trend. In other words, if the scenario comes true and AUDUSD breaches the lower border, the price could continue its move toward 0.7126.
AUDUSD M5
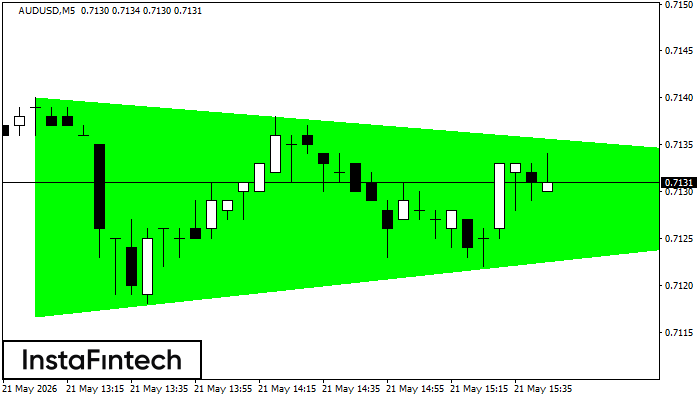
Bullish Symmetrical Triangle
According to the chart of M5, AUDUSD formed the Bullish Symmetrical Triangle pattern, which signals the trend will continue. Description. The upper border of the pattern touches the coordinates 0.7140/0.7130 whereas the lower border goes across 0.7117/0.7130. The pattern width is measured on the chart at 23 pips. If the Bullish Symmetrical Triangle pattern is in progress during the upward trend, this indicates the current trend will go on. In case 0.7130 is broken, the price could continue its move toward 0.7145.
AUDUSD M5
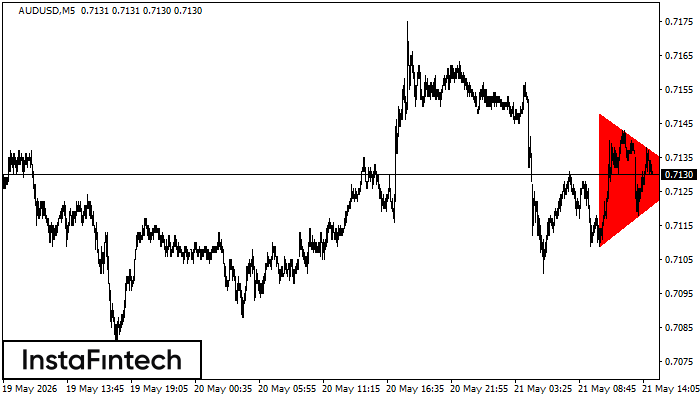
Bearish Symmetrical Triangle
According to the chart of M5, AUDUSD formed the Bearish Symmetrical Triangle pattern. Trading recommendations: A breach of the lower border 0.7109 is likely to encourage a continuation of the downward trend.
AUDUSD M5
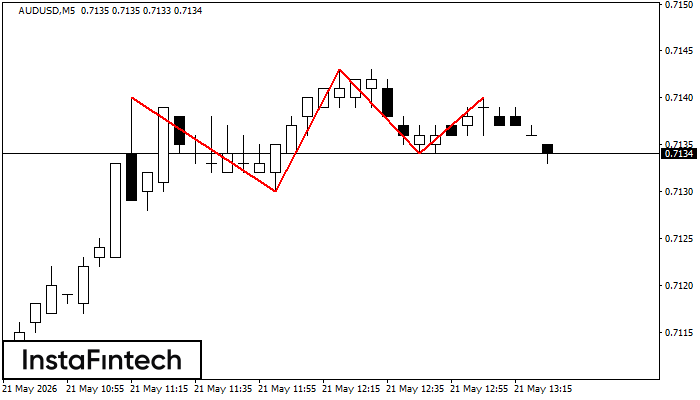
Triple Top
The Triple Top pattern has formed on the chart of the AUDUSD M5. Features of the pattern: borders have an ascending angle; the lower line of the pattern has the coordinates 0.7130/0.7134 with the upper limit 0.7140/0.7140; the projection of the width is 10 points. The formation of the Triple Top figure most likely indicates a change in the trend from upward to downward. This means that in the event of a breakdown of the support level of 0.7130, the price is most likely to continue the downward movement.
AUDUSD M5
Head and Shoulders
According to the chart of M5, AUDUSD formed the Head and Shoulders pattern. The Head’s top is set at 0.7175 while the median line of the Neck is found at 0.7146/0.7150. The formation of the Head and Shoulders pattern evidently signals a reversal of the upward trend. In other words, in case the scenario comes true, the price of AUDUSD will go towards 0.7135.
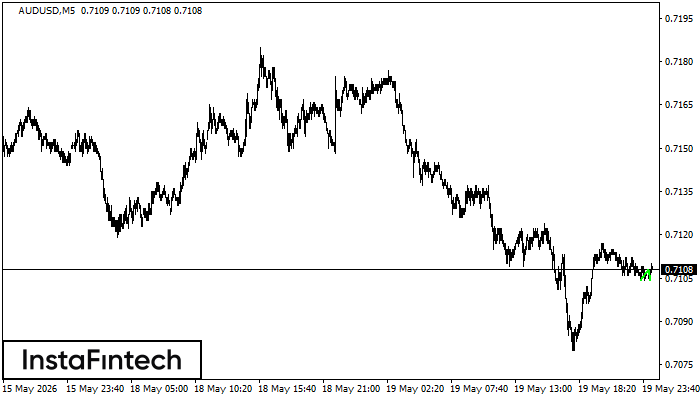
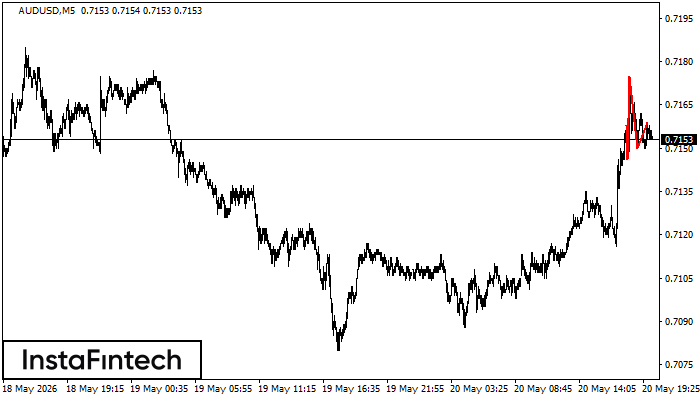
AUDUSD M5
Double Bottom
The Double Bottom pattern has been formed on AUDUSD M5; the upper boundary is 0.7108; the lower boundary is 0.7104. The width of the pattern is 4 points. In case of a break of the upper boundary 0.7108, a change in the trend can be predicted where the width of the pattern will coincide with the distance to a possible take profit level.