 中文
中文  Русский
 English
 Bahasa Indonesia
 Bahasa Malay
 ไทย
ไทย Español
 Deutsch
 Български
 Français
 Tiếng Việt
 বাংলা
বাংলা हिन्दी
 Čeština
 Українська
 Română
FX.co ★ Patterns #Bitcoin | Bitcoin cryptocurrency Rate in the Forex market

#Bitcoin M5
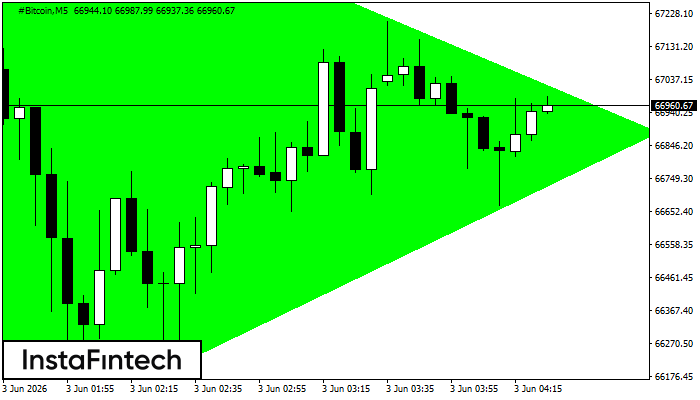
Bullish Symmetrical Triangle
According to the chart of M5, #Bitcoin formed the Bullish Symmetrical Triangle pattern. Description: This is the pattern of a trend continuation. 67924.91 and 65692.73 are the coordinates of the upper and lower borders respectively. The pattern width is measured on the chart at 223218 pips. Outlook: If the upper border 67924.91 is broken, the price is likely to continue its move by 66881.86.
#Bitcoin M5
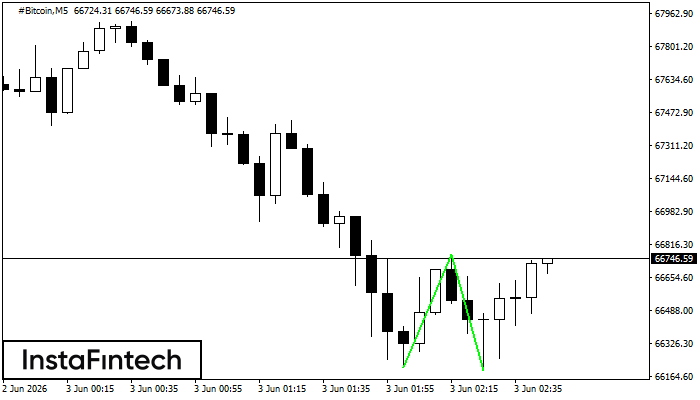
Double Bottom
The Double Bottom pattern has been formed on #Bitcoin M5. This formation signals a reversal of the trend from downwards to upwards. The signal is that a buy trade should be opened after the upper boundary of the pattern 66769.99 is broken. The further movements will rely on the width of the current pattern 56206 points.
#Bitcoin M5
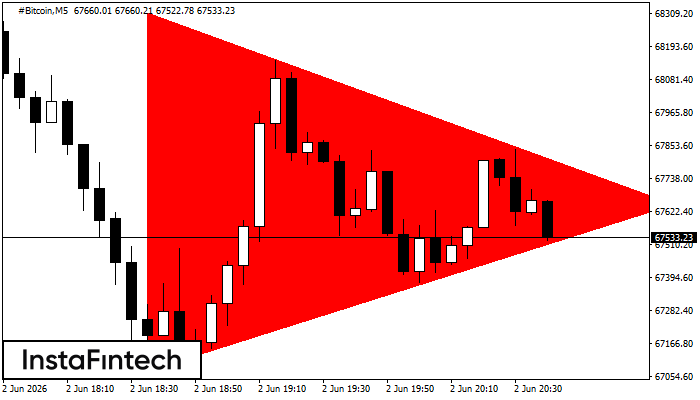
Bearish Symmetrical Triangle
According to the chart of M5, #Bitcoin formed the Bearish Symmetrical Triangle pattern. This pattern signals a further downward trend in case the lower border 67074.59 is breached. Here, a hypothetical profit will equal the width of the available pattern that is -123618 pips.
#Bitcoin M5
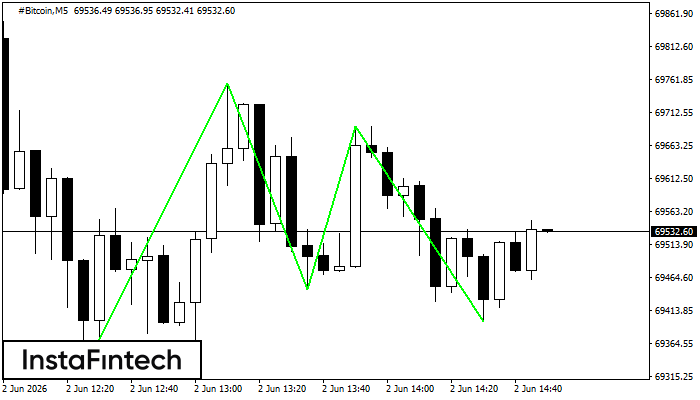
Triple Bottom
The Triple Bottom pattern has been formed on #Bitcoin M5. It has the following characteristics: resistance level 69756.65/69691.07; support level 69324.12/69397.75; the width is 43253 points. In the event of a breakdown of the resistance level of 69756.65, the price is likely to continue an upward movement at least to 69446.46.
#Bitcoin M5
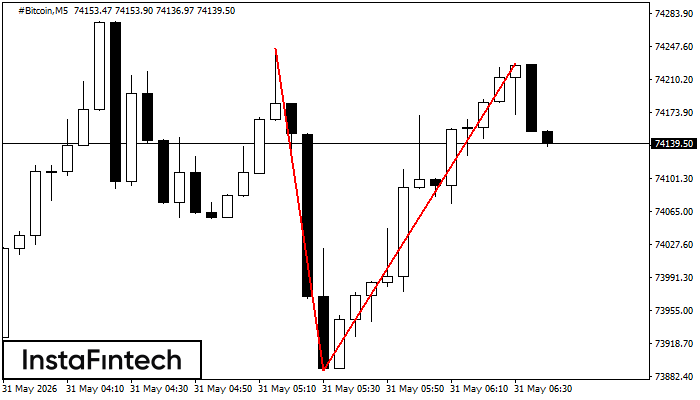
Double Top
On the chart of #Bitcoin M5 the Double Top reversal pattern has been formed. Characteristics: the upper boundary 74228.51; the lower boundary 73888.82; the width of the pattern 33969 points. The signal: a break of the lower boundary will cause continuation of the downward trend targeting the 73888.67 level.
#Bitcoin M5
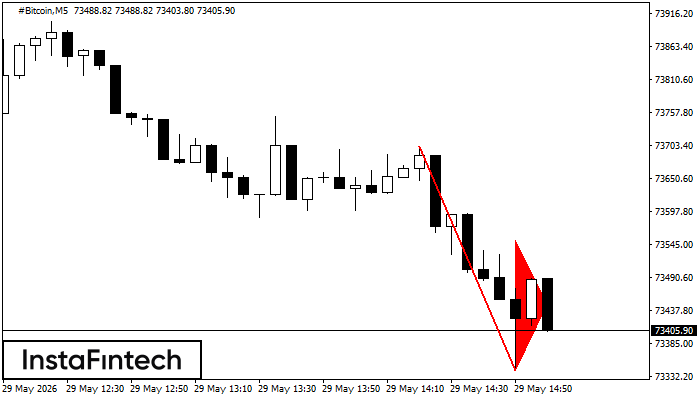
Bearish pennant
The Bearish pennant pattern has formed on the #Bitcoin M5 chart. It signals potential continuation of the existing trend. Specifications: the pattern’s bottom has the coordinate of 73341.53; the projection of the flagpole height is equal to 36144 pips. In case the price breaks out the pattern’s bottom of 73341.53, the downtrend is expected to continue for further level 73341.38.
#Bitcoin M30
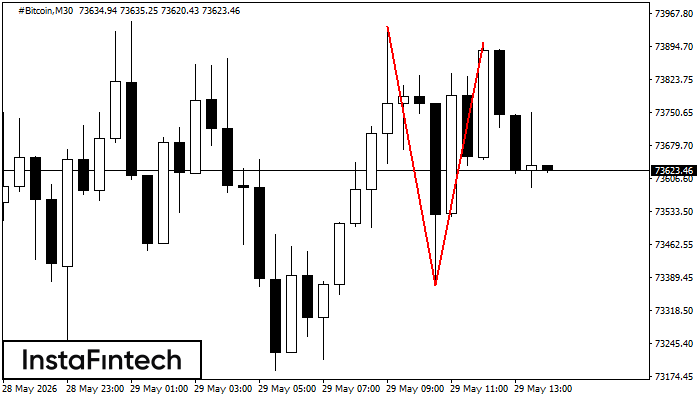
Double Top
On the chart of #Bitcoin M30 the Double Top reversal pattern has been formed. Characteristics: the upper boundary 73903.79; the lower boundary 73373.23; the width of the pattern 53056 points. The signal: a break of the lower boundary will cause continuation of the downward trend targeting the 73372.93 level.
#Bitcoin M5
Bearish Symmetrical Triangle
According to the chart of M5, #Bitcoin formed the Bearish Symmetrical Triangle pattern. Description: The lower border is 73187.10/73590.26 and upper border is 74108.40/73590.26. The pattern width is measured on the chart at -92130 pips. The formation of the Bearish Symmetrical Triangle pattern evidently signals a continuation of the downward trend. In other words, if the scenario comes true and #Bitcoin breaches the lower border, the price could continue its move toward 73590.11.
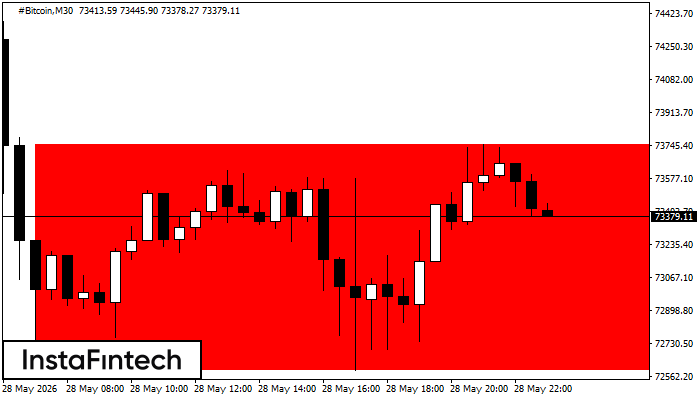
#Bitcoin M30
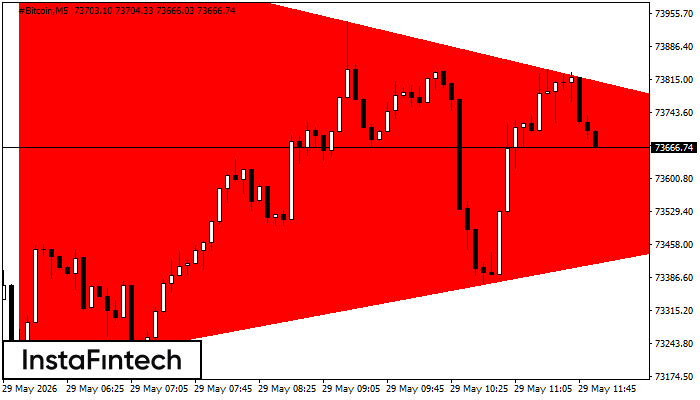
Bearish Rectangle
According to the chart of M30, #Bitcoin formed the Bearish Rectangle which is a pattern of a trend continuation. The pattern is contained within the following borders: lower border 72591.64 – 72591.64 and upper border 73750.01 – 73750.01. In case the lower border is broken, the instrument is likely to follow the downward trend.
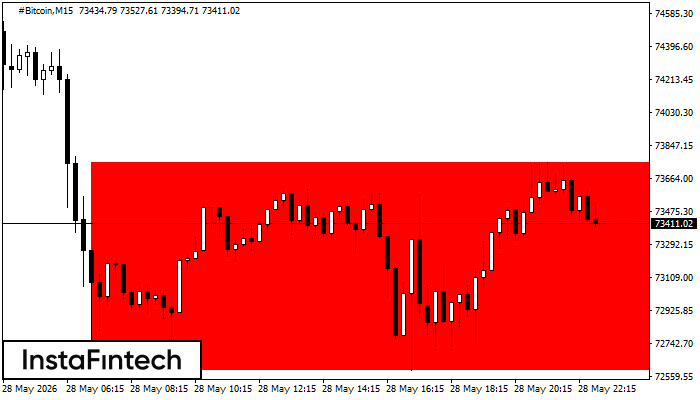
#Bitcoin M15
Bearish Rectangle
According to the chart of M15, #Bitcoin formed the Bearish Rectangle. This type of a pattern indicates a trend continuation. It consists of two levels: resistance 73750.01 - 0.00 and support 72591.64 – 72591.64. In case the resistance level 72591.64 - 72591.64 is broken, the instrument is likely to follow the bearish trend.