 中文
中文  Русский
 English
 Bahasa Indonesia
 Bahasa Malay
 ไทย
ไทย Español
 Deutsch
 Български
 Français
 Tiếng Việt
 বাংলা
বাংলা हिन्दी
 Čeština
 Українська
 Română
FX.co ★ Patterns EURCAD | Euro (EUR) to Canadian Dollar (CAD) Rate in the Forex market


EURCAD M5
Triple Top
On the chart of the EURCAD M5 trading instrument, the Triple Top pattern that signals a trend change has formed. It is possible that after formation of the third peak, the price will try to break through the resistance level 1.6063, where we advise to open a trading position for sale. Take profit is the projection of the pattern’s width, which is 15 points.

EURCAD M15
Bullish pennant
The Bullish pennant graphic pattern has formed on the EURCAD M15 instrument. This pattern type falls under the category of continuation patterns. In this case, if the quote can breaks out high, is expected to continue the upward trend to level 1.6100.

EURCAD M30
Bullish pennant
The Bullish pennant pattern is formed on the EURCAD M30 chart. It is a type of the continuation pattern. Supposedly, in case the price is fixed above the pennant’s high of 1.6078, a further uptrend is possible.
EURCAD M15
Bullish Flag
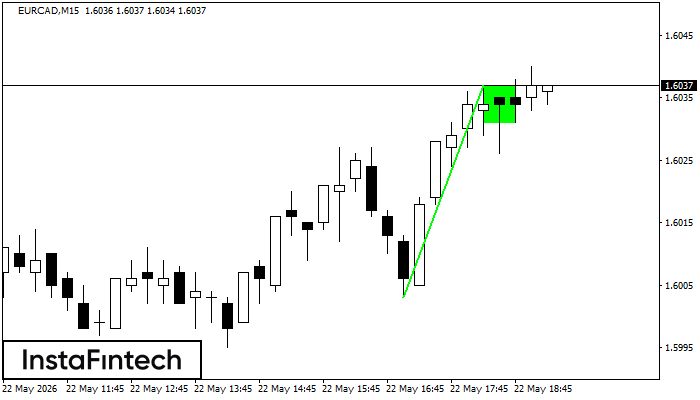
The Bullish Flag pattern has been formed on EURCAD at M15. The lower boundary of the pattern is located at 1.6031/1.6031, while the higher boundary lies at 1.6037/1.6037. The projection of the flagpole is 34 points. This formation signals that the upward trend is most likely to continue. Therefore, if the level of 1.6037 is broken, the price will move further upwards.
EURCAD M30
Double Top
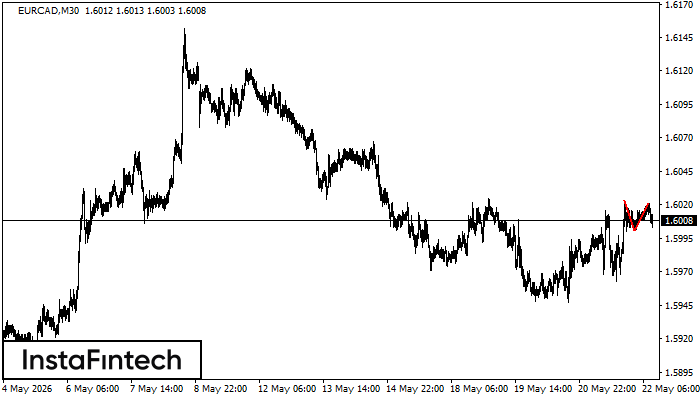
The Double Top reversal pattern has been formed on EURCAD M30. Characteristics: the upper boundary 1.6023; the lower boundary 1.6001; the width of the pattern is 20 points. Sell trades are better to be opened below the lower boundary 1.6001 with a possible movements towards the 1.5971 level.
EURCAD M30
Double Top
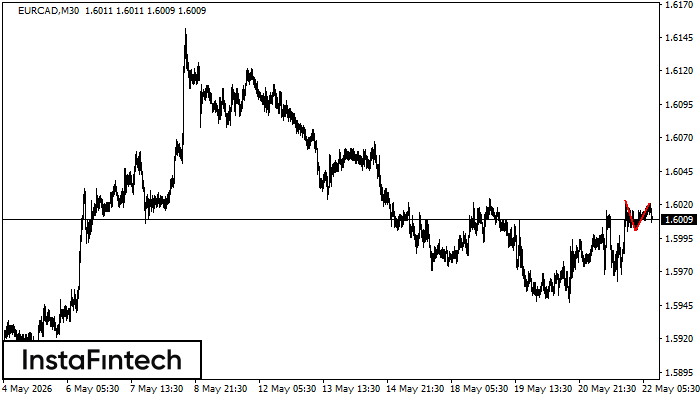
On the chart of EURCAD M30 the Double Top reversal pattern has been formed. Characteristics: the upper boundary 1.6021; the lower boundary 1.6001; the width of the pattern 20 points. The signal: a break of the lower boundary will cause continuation of the downward trend targeting the 1.5971 level.
EURCAD M5
Bearish Symmetrical Triangle
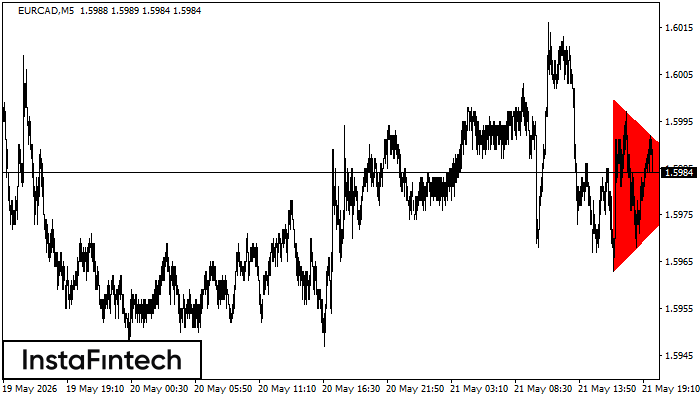
According to the chart of M5, EURCAD formed the Bearish Symmetrical Triangle pattern. This pattern signals a further downward trend in case the lower border 1.5963 is breached. Here, a hypothetical profit will equal the width of the available pattern that is -37 pips.
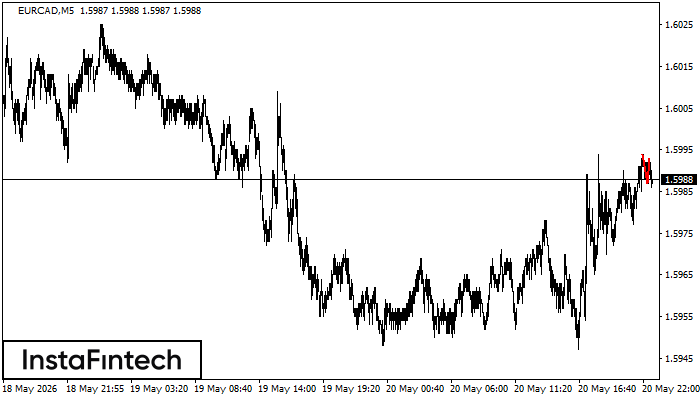
EURCAD M5
Double Top
On the chart of EURCAD M5 the Double Top reversal pattern has been formed. Characteristics: the upper boundary 1.5993; the lower boundary 1.5987; the width of the pattern 6 points. The signal: a break of the lower boundary will cause continuation of the downward trend targeting the 1.5972 level.
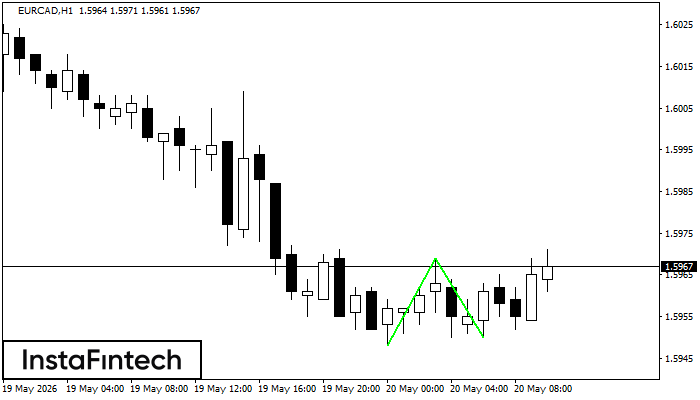
EURCAD H1
Double Bottom
The Double Bottom pattern has been formed on EURCAD H1; the upper boundary is 1.5969; the lower boundary is 1.5950. The width of the pattern is 21 points. In case of a break of the upper boundary 1.5969, a change in the trend can be predicted where the width of the pattern will coincide with the distance to a possible take profit level.
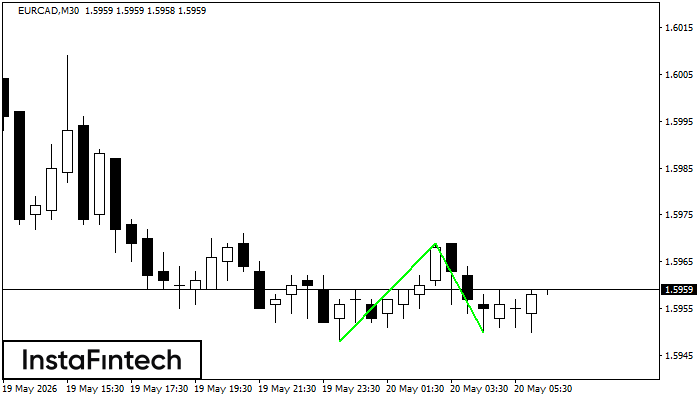
EURCAD M30
Double Bottom
The Double Bottom pattern has been formed on EURCAD M30. Characteristics: the support level 1.5948; the resistance level 1.5969; the width of the pattern 21 points. If the resistance level is broken, a change in the trend can be predicted with the first target point lying at the distance of 19 points.