 中文
中文  Русский
 English
 Bahasa Indonesia
 Bahasa Malay
 ไทย
ไทย Español
 Deutsch
 Български
 Français
 Tiếng Việt
 বাংলা
বাংলা हिन्दी
 Čeština
 Українська
 Română
FX.co ★ Patterns EURCHF | Euro (EUR) to Swiss Franc (CHF) Rate in the Forex market


EURCHF M15
Double Bottom
The Double Bottom pattern has been formed on EURCHF M15; the upper boundary is 0.9131; the lower boundary is 0.9102. The width of the pattern is 28 points. In case of a break of the upper boundary 0.9131, a change in the trend can be predicted where the width of the pattern will coincide with the distance to a possible take profit level.
EURCHF M30
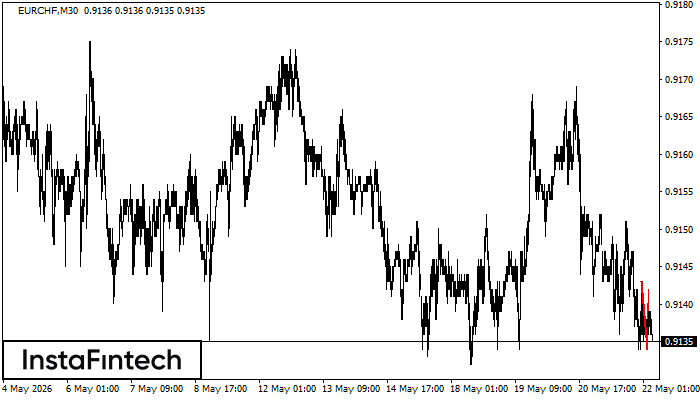
Bearish Flag
The Bearish Flag pattern has been formed on the chart EURCHF M30 which signals that the downward trend will continue. If the price breaks below the low at 0.9134, then it is most likely to move further downwards. The price will likely move by the number of points which equals the length of the flag pole (20 points).
EURCHF M30
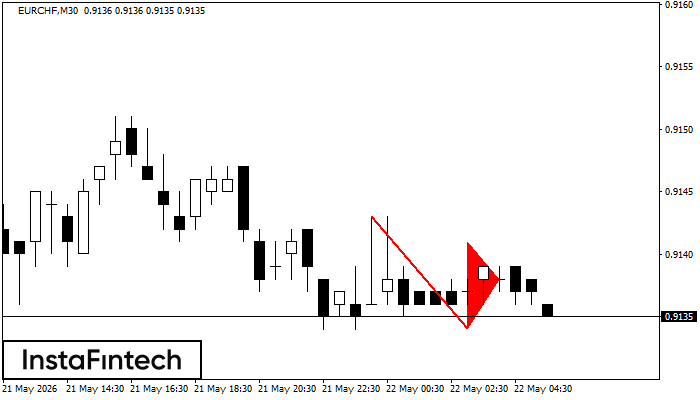
Bearish pennant
The Bearish pennant pattern has formed on the EURCHF M30 chart. The pattern signals continuation of the downtrend in case the pennant’s low of 0.9134 is broken through. Recommendations: Place the sell stop pending order 10 pips below the pattern’s low. Place the take profit order at the projection distance of the flagpole height.
EURCHF M15
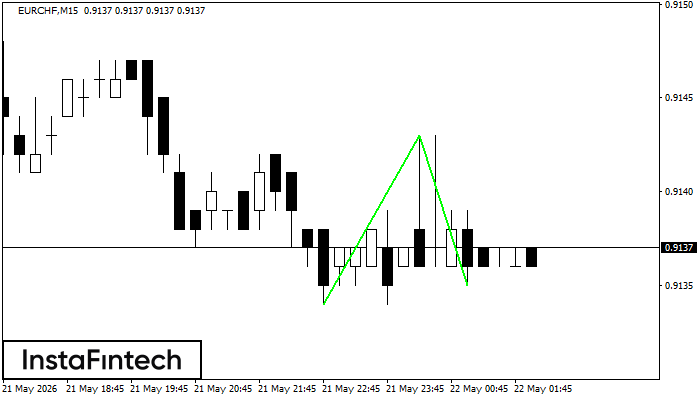
Double Bottom
The Double Bottom pattern has been formed on EURCHF M15; the upper boundary is 0.9143; the lower boundary is 0.9135. The width of the pattern is 9 points. In case of a break of the upper boundary 0.9143, a change in the trend can be predicted where the width of the pattern will coincide with the distance to a possible take profit level.
EURCHF M30
Triple Top
The Triple Top pattern has formed on the chart of the EURCHF M30 trading instrument. It is a reversal pattern featuring the following characteristics: resistance level -1, support level -7, and pattern’s width 19. Forecast If the price breaks through the support level 0.9149, it is likely to move further down to 0.9137.
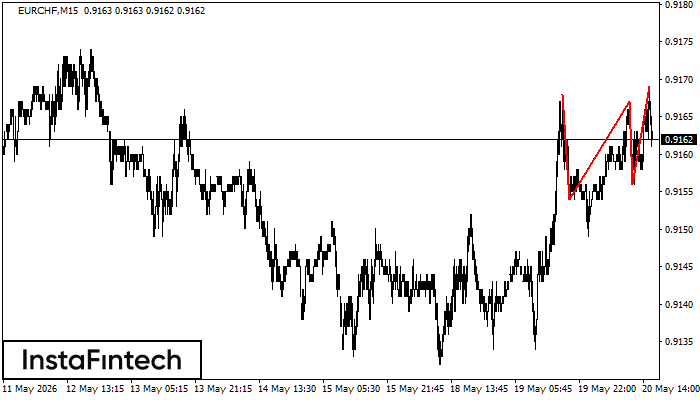
EURCHF M15
Triple Top
The Triple Top pattern has formed on the chart of the EURCHF M15. Features of the pattern: borders have an ascending angle; the lower line of the pattern has the coordinates 0.9154/0.9156 with the upper limit 0.9168/0.9169; the projection of the width is 14 points. The formation of the Triple Top figure most likely indicates a change in the trend from upward to downward. This means that in the event of a breakdown of the support level of 0.9154, the price is most likely to continue the downward movement.
EURCHF H1
Double Top
The Double Top pattern has been formed on EURCHF H1. It signals that the trend has been changed from upwards to downwards. Probably, if the base of the pattern 0.9149 is broken, the downward movement will continue.
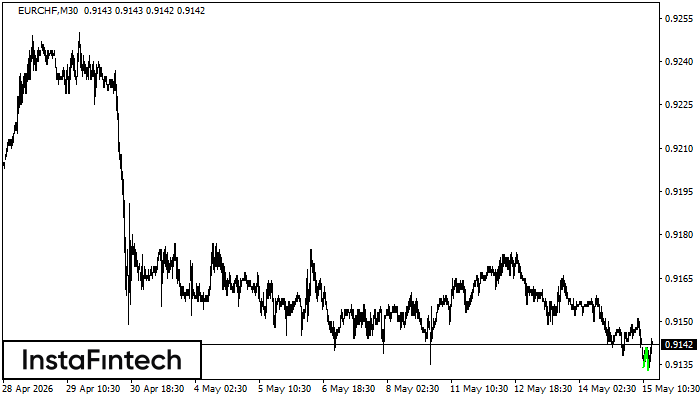
EURCHF M30
Double Bottom
The Double Bottom pattern has been formed on EURCHF M30; the upper boundary is 0.9141; the lower boundary is 0.9133. The width of the pattern is 7 points. In case of a break of the upper boundary 0.9141, a change in the trend can be predicted where the width of the pattern will coincide with the distance to a possible take profit level.
EURCHF H1
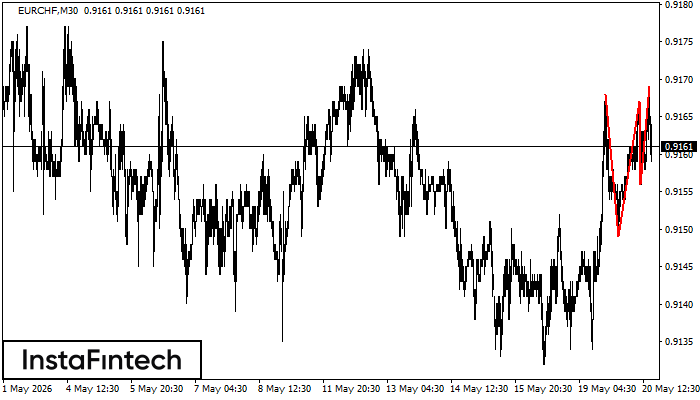
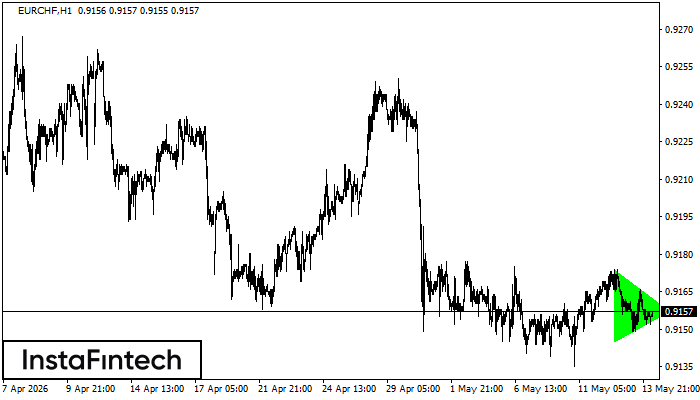
Bullish Symmetrical Triangle
According to the chart of H1, EURCHF formed the Bullish Symmetrical Triangle pattern. The lower border of the pattern touches the coordinates 0.9145/0.9157 whereas the upper border goes across 0.9174/0.9157. If the Bullish Symmetrical Triangle pattern is in progress, this evidently signals a further upward trend. In other words, in case the scenario comes true, the price of EURCHF will breach the upper border to head for 0.9197.
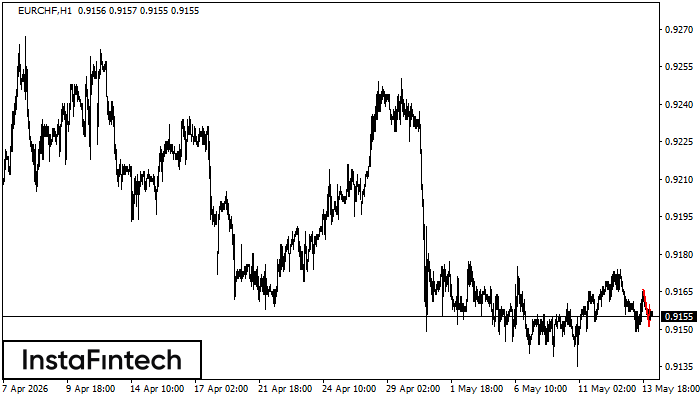
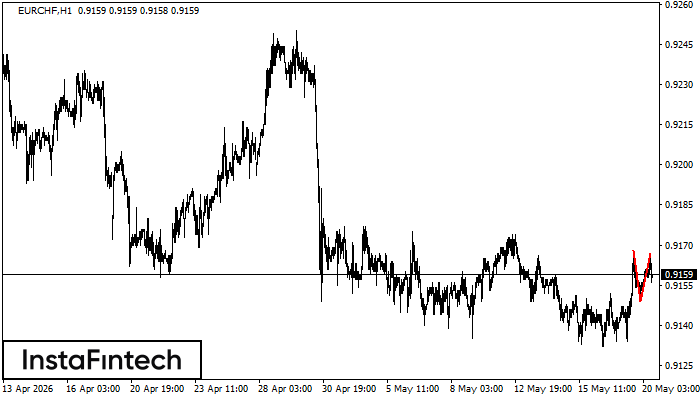
EURCHF H1
Bearish pennant
The Bearish pennant pattern has formed on the EURCHF H1 chart. This pattern type is characterized by a slight slowdown after which the price will move in the direction of the original trend. In case the price fixes below the pattern’s low of 0.9151, a trader will be able to successfully enter the sell position.