 中文
中文  Русский
 English
 Bahasa Indonesia
 Bahasa Malay
 ไทย
ไทย Español
 Deutsch
 Български
 Français
 Tiếng Việt
 বাংলা
বাংলা हिन्दी
 Čeština
 Українська
 Română
FX.co ★ Patterns EURJPY | Euro (EUR) to Japanese Yen (JPY) Rate in the Forex market

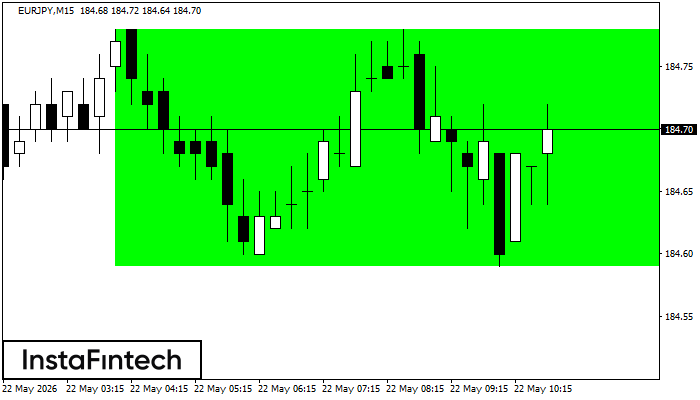
EURJPY M15
Bullish Rectangle
According to the chart of M15, EURJPY formed the Bullish Rectangle. The pattern indicates a trend continuation. The upper border is 184.78, the lower border is 184.59. The signal means that a long position should be opened above the upper border 184.78 of the Bullish Rectangle.
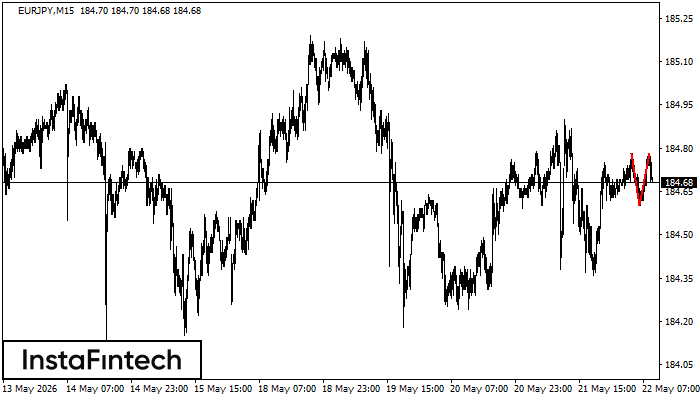
EURJPY M15
Double Top
On the chart of EURJPY M15 the Double Top reversal pattern has been formed. Characteristics: the upper boundary 184.78; the lower boundary 184.60; the width of the pattern 18 points. The signal: a break of the lower boundary will cause continuation of the downward trend targeting the 184.38 level.
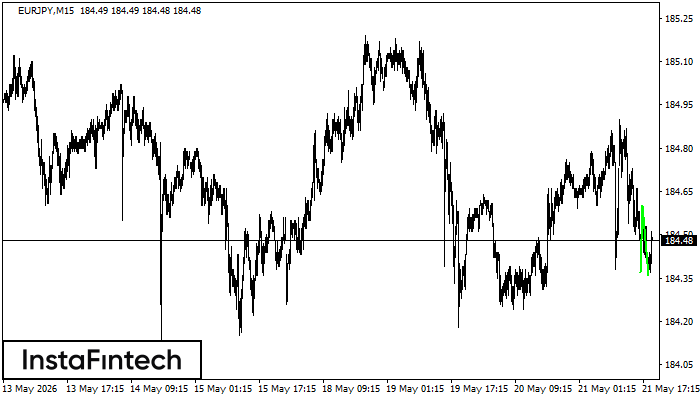
EURJPY M15
Double Bottom
The Double Bottom pattern has been formed on EURJPY M15. This formation signals a reversal of the trend from downwards to upwards. The signal is that a buy trade should be opened after the upper boundary of the pattern 184.60 is broken. The further movements will rely on the width of the current pattern 23 points.
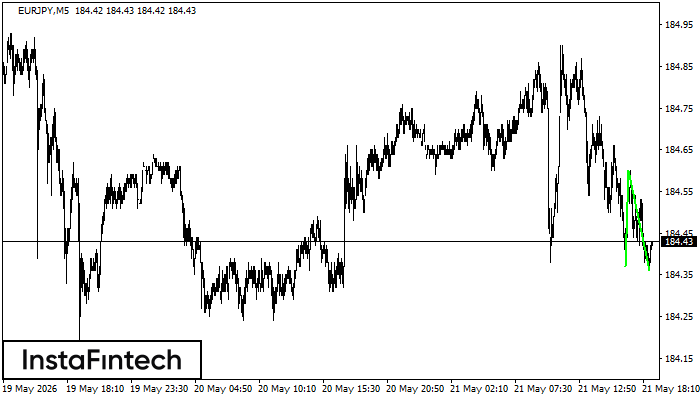
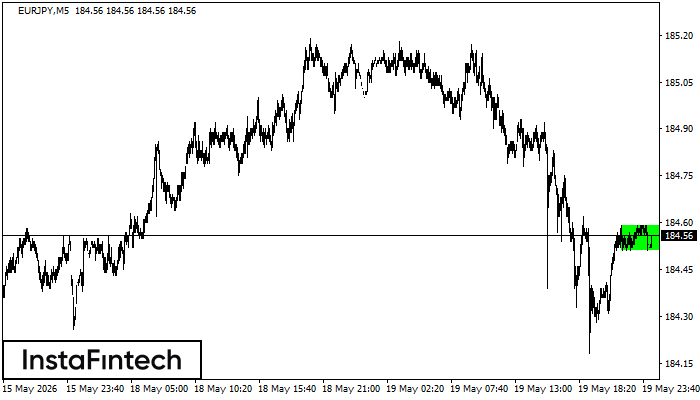
EURJPY M5
Double Bottom
The Double Bottom pattern has been formed on EURJPY M5. Characteristics: the support level 184.37; the resistance level 184.60; the width of the pattern 23 points. If the resistance level is broken, a change in the trend can be predicted with the first target point lying at the distance of 24 points.
EURJPY M5
Triple Top
On the chart of the EURJPY M5 trading instrument, the Triple Top pattern that signals a trend change has formed. It is possible that after formation of the third peak, the price will try to break through the resistance level 184.70, where we advise to open a trading position for sale. Take profit is the projection of the pattern’s width, which is 20 points.
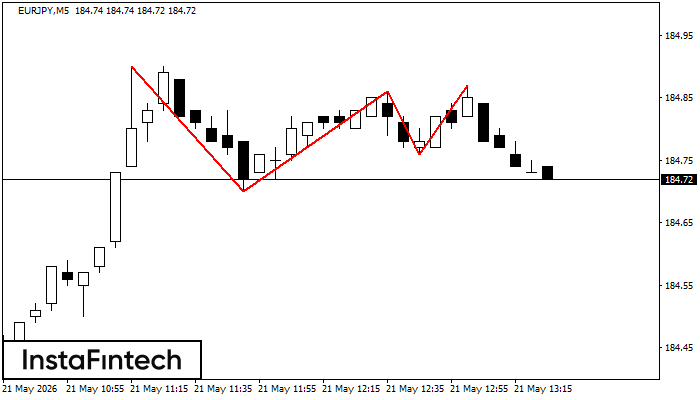
EURJPY M5
Triple Top
The Triple Top pattern has formed on the chart of the EURJPY M5 trading instrument. It is a reversal pattern featuring the following characteristics: resistance level 1, support level -2, and pattern’s width 18. Forecast If the price breaks through the support level 184.48, it is likely to move further down to 184.51.
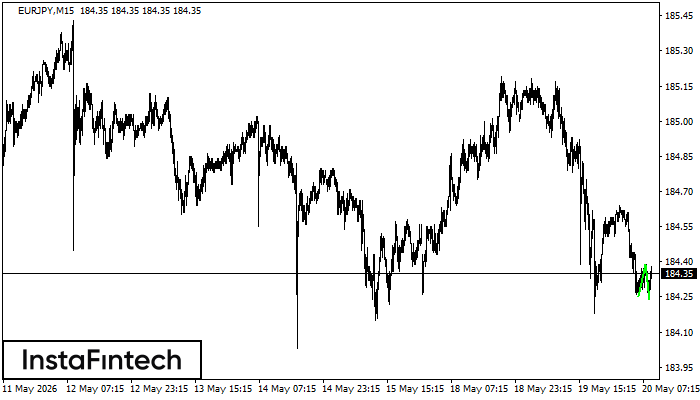
EURJPY M15
Double Bottom
The Double Bottom pattern has been formed on EURJPY M15. Characteristics: the support level 184.25; the resistance level 184.39; the width of the pattern 14 points. If the resistance level is broken, a change in the trend can be predicted with the first target point lying at the distance of 15 points.
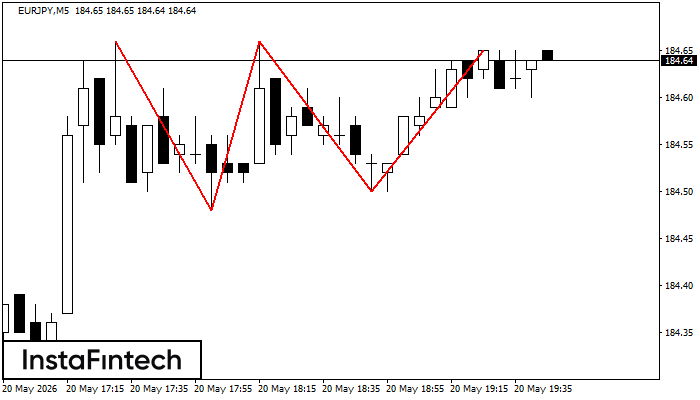
EURJPY M5
Bullish Rectangle
According to the chart of M5, EURJPY formed the Bullish Rectangle. This type of a pattern indicates a trend continuation. It consists of two levels: resistance 184.59 and support 184.51. In case the resistance level 184.59 - 184.59 is broken, the instrument is likely to follow the bullish trend.
EURJPY M15
Triple Bottom
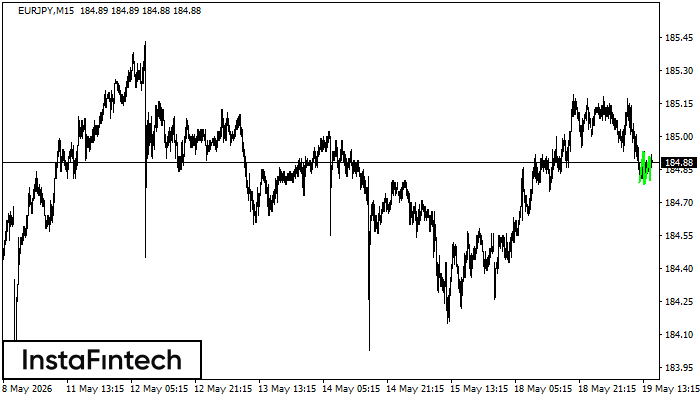
The Triple Bottom pattern has formed on the chart of the EURJPY M15 trading instrument. The pattern signals a change in the trend from downwards to upwards in the case of breakdown of 184.93/184.91.
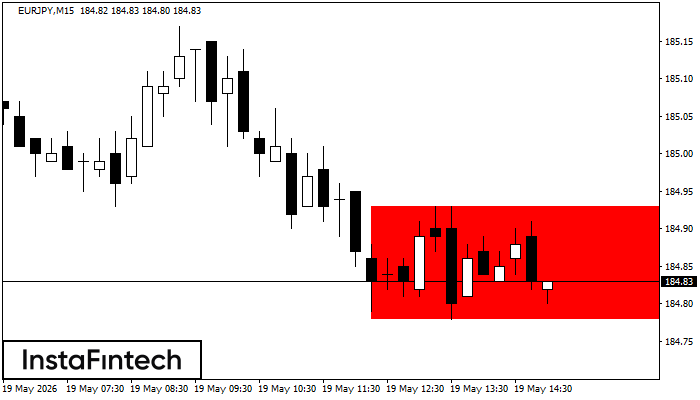
EURJPY M15
Bearish Rectangle
According to the chart of M15, EURJPY formed the Bearish Rectangle. This type of a pattern indicates a trend continuation. It consists of two levels: resistance 184.93 - 0.00 and support 184.78 – 184.78. In case the resistance level 184.78 - 184.78 is broken, the instrument is likely to follow the bearish trend.