 中文
中文  Русский
 English
 Bahasa Indonesia
 Bahasa Malay
 ไทย
ไทย Español
 Deutsch
 Български
 Français
 Tiếng Việt
 বাংলা
বাংলা हिन्दी
 Čeština
 Українська
 Română
FX.co ★ Patterns EURNZD | Euro (EUR) to New Zealand Dollar (NZD) Rate in the Forex market

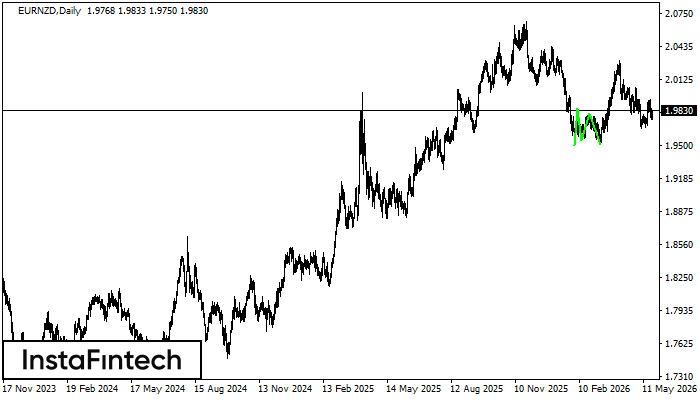
EURNZD D1
Triple Bottom
The Triple Bottom pattern has been formed on EURNZD D1. It has the following characteristics: resistance level 1.9851/1.9803; support level 1.9496/1.9509; the width is 355 points. In the event of a breakdown of the resistance level of 1.9851, the price is likely to continue an upward movement at least to 1.9592.

EURNZD D1
Triple Bottom
The Triple Bottom pattern has formed on the chart of EURNZD D1. Features of the pattern: The lower line of the pattern has coordinates 1.9851 with the upper limit 1.9851/1.9803, the projection of the width is 355 points. The formation of the Triple Bottom pattern most likely indicates a change in the trend from downward to upward. This means that in the event of a breakdown of the resistance level 1.9496, the price is most likely to continue the upward movement.
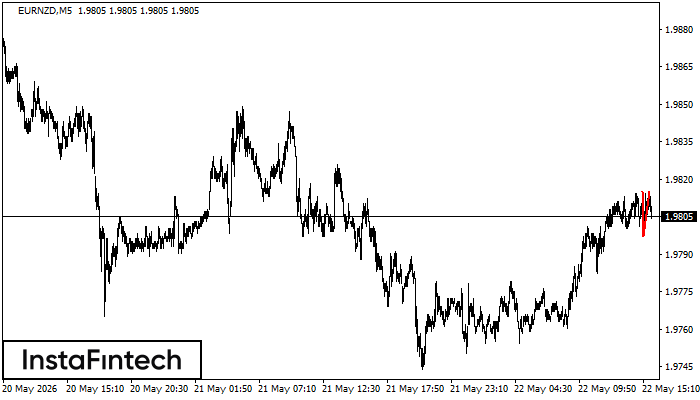
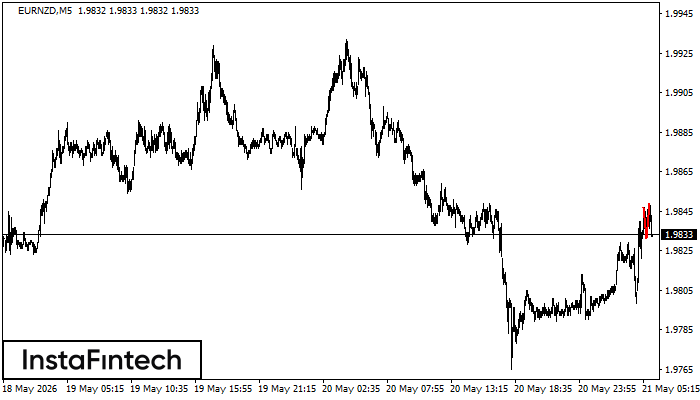
EURNZD M5
Double Top
The Double Top reversal pattern has been formed on EURNZD M5. Characteristics: the upper boundary 1.9815; the lower boundary 1.9797; the width of the pattern is 18 points. Sell trades are better to be opened below the lower boundary 1.9797 with a possible movements towards the 1.9782 level.
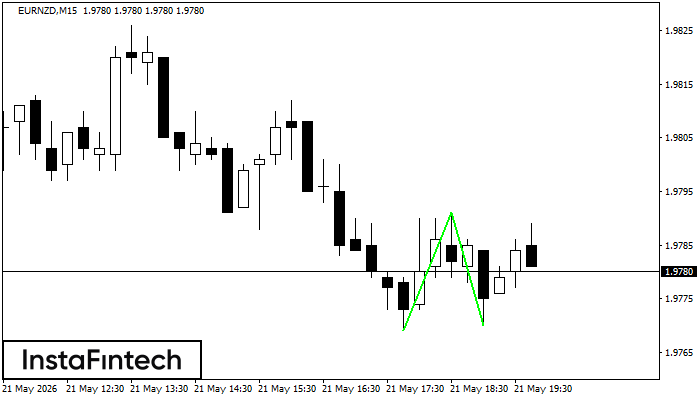
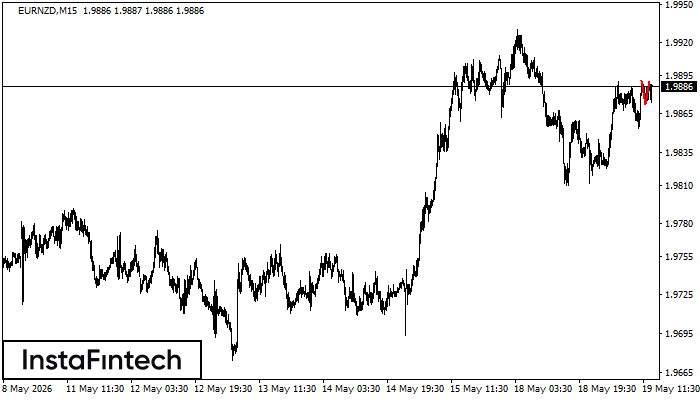
EURNZD M15
Double Bottom
The Double Bottom pattern has been formed on EURNZD M15. This formation signals a reversal of the trend from downwards to upwards. The signal is that a buy trade should be opened after the upper boundary of the pattern 1.9791 is broken. The further movements will rely on the width of the current pattern 22 points.
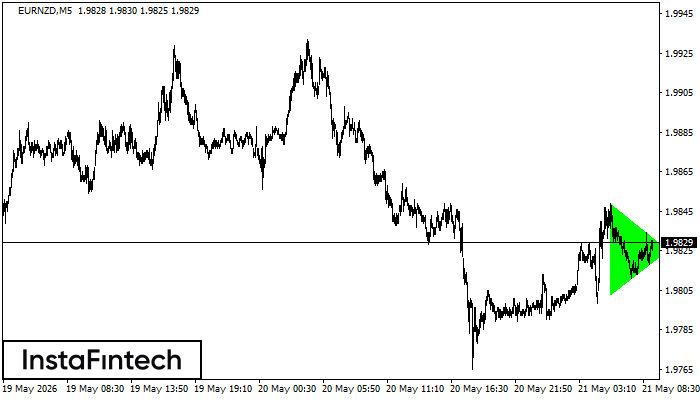
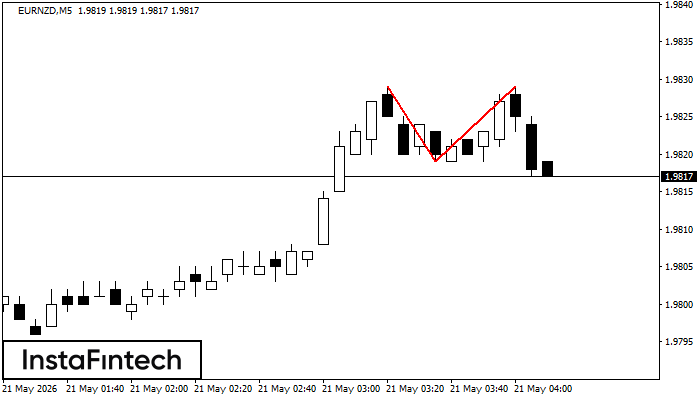
EURNZD M5
Bullish Symmetrical Triangle
According to the chart of M5, EURNZD formed the Bullish Symmetrical Triangle pattern, which signals the trend will continue. Description. The upper border of the pattern touches the coordinates 1.9849/1.9825 whereas the lower border goes across 1.9803/1.9825. The pattern width is measured on the chart at 46 pips. If the Bullish Symmetrical Triangle pattern is in progress during the upward trend, this indicates the current trend will go on. In case 1.9825 is broken, the price could continue its move toward 1.9840.
EURNZD M5
Double Top
The Double Top reversal pattern has been formed on EURNZD M5. Characteristics: the upper boundary 1.9847; the lower boundary 1.9831; the width of the pattern is 18 points. Sell trades are better to be opened below the lower boundary 1.9831 with a possible movements towards the 1.9816 level.
EURNZD M5
Double Top
On the chart of EURNZD M5 the Double Top reversal pattern has been formed. Characteristics: the upper boundary 1.9829; the lower boundary 1.9819; the width of the pattern 10 points. The signal: a break of the lower boundary will cause continuation of the downward trend targeting the 1.9804 level.
EURNZD M15
Head and Shoulders
The technical pattern called Head and Shoulders has appeared on the chart of EURNZD M15. There are weighty reasons to suggest that the price will surpass the Neckline 1.9866/1.9871 after the right shoulder has been formed. So, the trend is set to change with the price heading for 1.9849.
EURNZD M5
Bearish Symmetrical Triangle
According to the chart of M5, EURNZD formed the Bearish Symmetrical Triangle pattern. Trading recommendations: A breach of the lower border 1.9871 is likely to encourage a continuation of the downward trend.
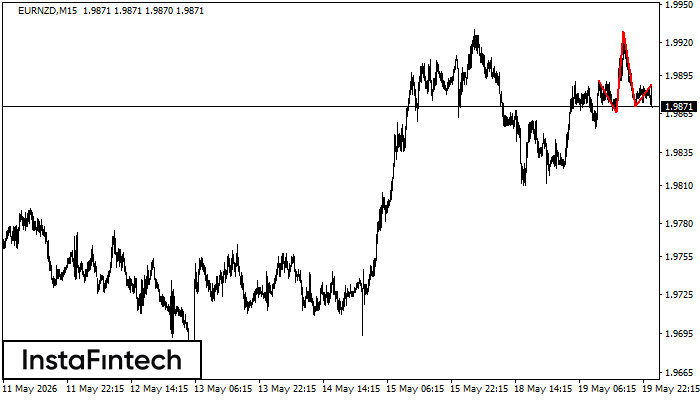
EURNZD M15
Double Top
The Double Top reversal pattern has been formed on EURNZD M15. Characteristics: the upper boundary 1.9891; the lower boundary 1.9872; the width of the pattern is 18 points. Sell trades are better to be opened below the lower boundary 1.9872 with a possible movements towards the 1.9849 level.