 中文
中文  Русский
 English
 Bahasa Indonesia
 Bahasa Malay
 ไทย
ไทย Español
 Deutsch
 Български
 Français
 Tiếng Việt
 বাংলা
বাংলা हिन्दी
 Čeština
 Українська
 Română
FX.co ★ Patterns EURUSD | Euro (EUR) to US Dollar (USD) Rate in the Forex market

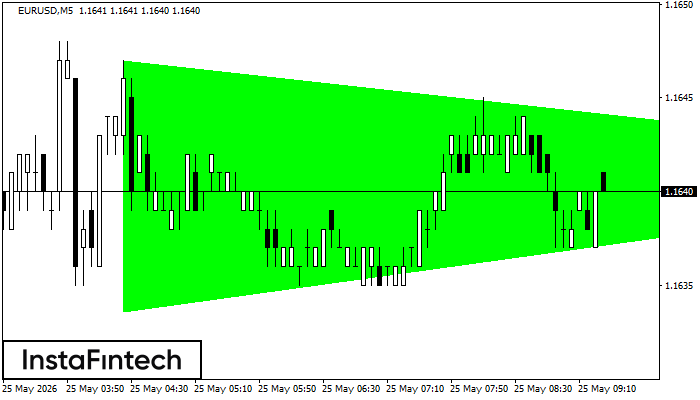
EURUSD M5
Bullish Symmetrical Triangle
According to the chart of M5, EURUSD formed the Bullish Symmetrical Triangle pattern, which signals the trend will continue. Description. The upper border of the pattern touches the coordinates 1.1647/1.1641 whereas the lower border goes across 1.1634/1.1641. The pattern width is measured on the chart at 13 pips. If the Bullish Symmetrical Triangle pattern is in progress during the upward trend, this indicates the current trend will go on. In case 1.1641 is broken, the price could continue its move toward 1.1656.
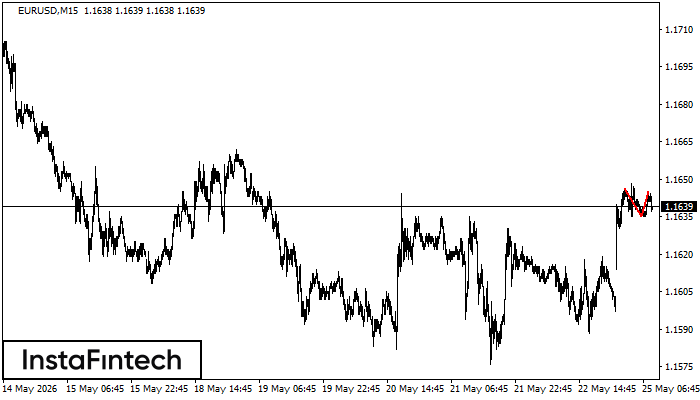
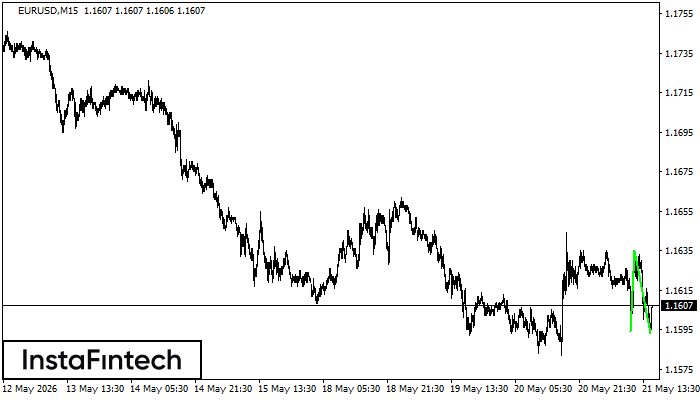
EURUSD M15
Double Top
On the chart of EURUSD M15 the Double Top reversal pattern has been formed. Characteristics: the upper boundary 1.1645; the lower boundary 1.1635; the width of the pattern 10 points. The signal: a break of the lower boundary will cause continuation of the downward trend targeting the 1.1612 level.
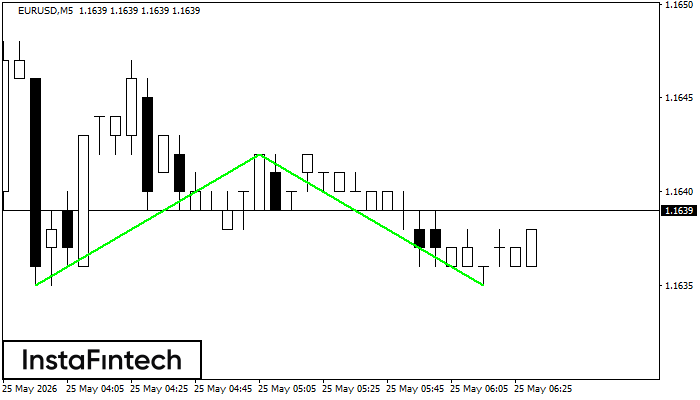
EURUSD M5
Double Bottom
The Double Bottom pattern has been formed on EURUSD M5. This formation signals a reversal of the trend from downwards to upwards. The signal is that a buy trade should be opened after the upper boundary of the pattern 1.1642 is broken. The further movements will rely on the width of the current pattern 7 points.
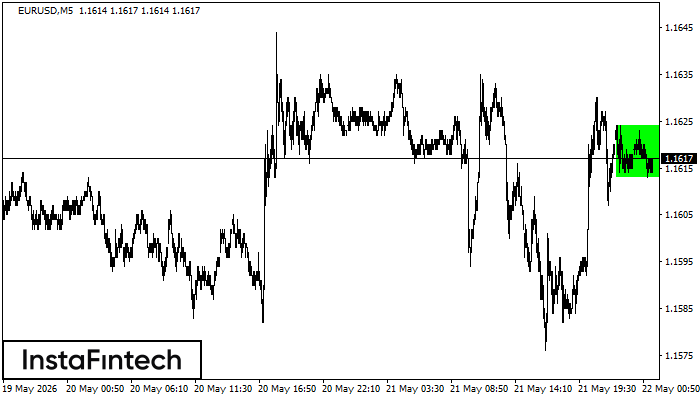
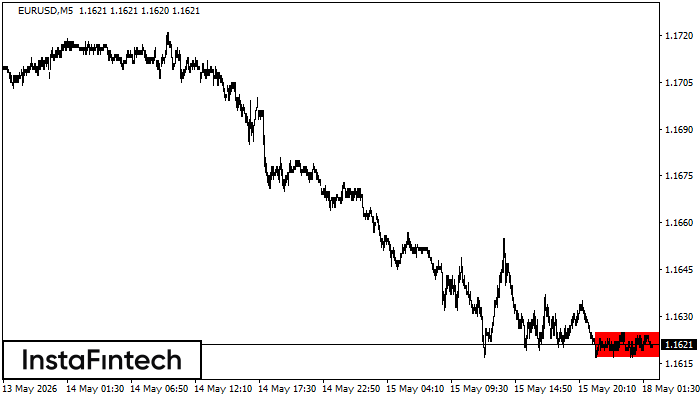
EURUSD M5
Bullish Rectangle
According to the chart of M5, EURUSD formed the Bullish Rectangle which is a pattern of a trend continuation. The pattern is contained within the following borders: the lower border 1.1613 – 1.1613 and upper border 1.1624 – 1.1624. In case the upper border is broken, the instrument is likely to follow the upward trend.
EURUSD M15
Double Bottom
The Double Bottom pattern has been formed on EURUSD M15; the upper boundary is 1.1635; the lower boundary is 1.1593. The width of the pattern is 41 points. In case of a break of the upper boundary 1.1635, a change in the trend can be predicted where the width of the pattern will coincide with the distance to a possible take profit level.

EURUSD M5
Bearish Flag
The Bearish Flag pattern has been formed on EURUSD at M5. The lower boundary of the pattern is located at 1.1615/1.1621 while the upper boundary lies at 1.1619/1.1625. The projection of the flagpole is 8 points. This formation signals that the downward trend is most likely to continue. Therefore, if the level of 1.1615 is broken, the price will move further downwards.

EURUSD M5
Bearish pennant
The Bearish pennant pattern has formed on the EURUSD M5 chart. This pattern type is characterized by a slight slowdown after which the price will move in the direction of the original trend. In case the price fixes below the pattern’s low of 1.1615, a trader will be able to successfully enter the sell position.
EURUSD M5
Bearish Rectangle
According to the chart of M5, EURUSD formed the Bearish Rectangle. The pattern indicates a trend continuation. The upper border is 1.1625, the lower border is 1.1617. The signal means that a short position should be opened after fixing a price below the lower border 1.1617 of the Bearish Rectangle.
EURUSD M15
Double Bottom
The Double Bottom pattern has been formed on EURUSD M15. This formation signals a reversal of the trend from downwards to upwards. The signal is that a buy trade should be opened after the upper boundary of the pattern 1.1623 is broken. The further movements will rely on the width of the current pattern 6 points.

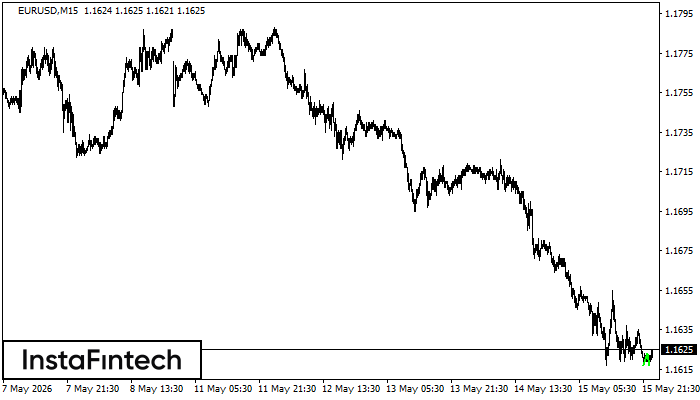
EURUSD M15
Double Bottom
The Double Bottom pattern has been formed on EURUSD M15; the upper boundary is 1.1623; the lower boundary is 1.1617. The width of the pattern is 6 points. In case of a break of the upper boundary 1.1623, a change in the trend can be predicted where the width of the pattern will coincide with the distance to a possible take profit level.