 中文
中文  Русский
 English
 Bahasa Indonesia
 Bahasa Malay
 ไทย
ไทย Español
 Deutsch
 Български
 Français
 Tiếng Việt
 বাংলা
বাংলা हिन्दी
 Čeština
 Українська
 Română
FX.co ★ Patterns GBPCHF | British Pound (GBP) to Swiss Franc (CHF) Rate in the Forex market

GBPCHF M5
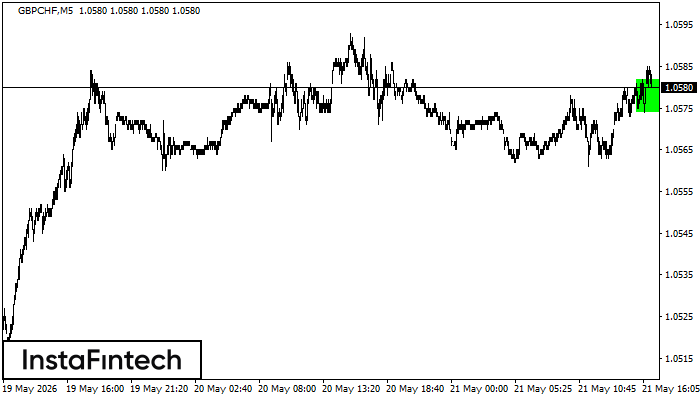
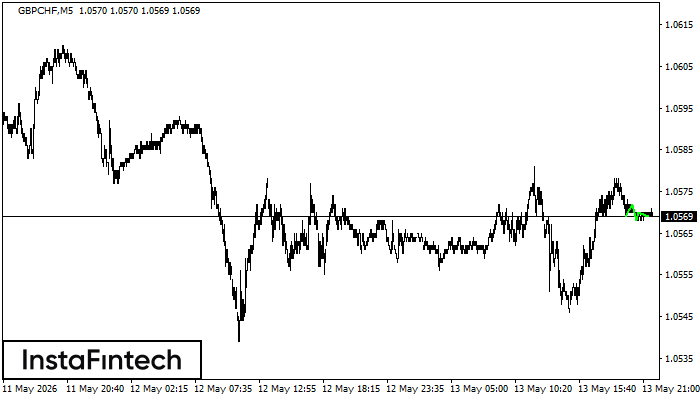
Bullish Rectangle
According to the chart of M5, GBPCHF formed the Bullish Rectangle. The pattern indicates a trend continuation. The upper border is 1.0582, the lower border is 1.0574. The signal means that a long position should be opened above the upper border 1.0582 of the Bullish Rectangle.
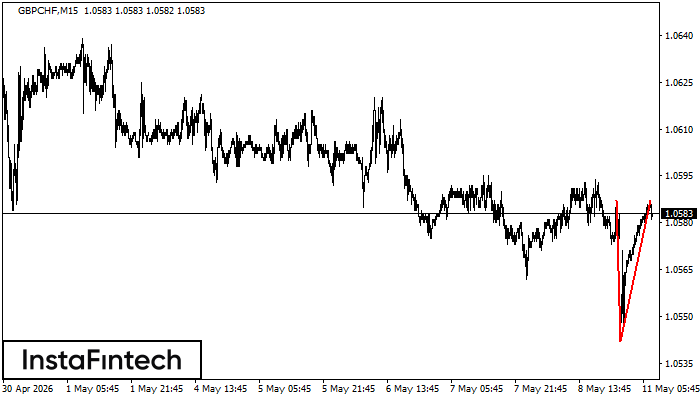
GBPCHF M15
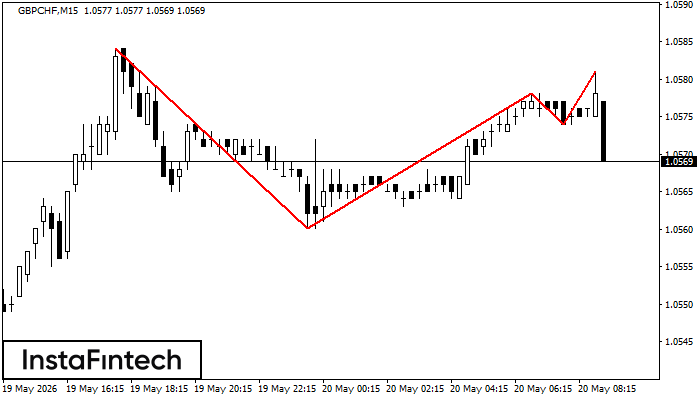
Triple Top
The Triple Top pattern has formed on the chart of the GBPCHF M15 trading instrument. It is a reversal pattern featuring the following characteristics: resistance level 3, support level -14, and pattern’s width 24. Forecast If the price breaks through the support level 1.0560, it is likely to move further down to 1.0555.
GBPCHF M5
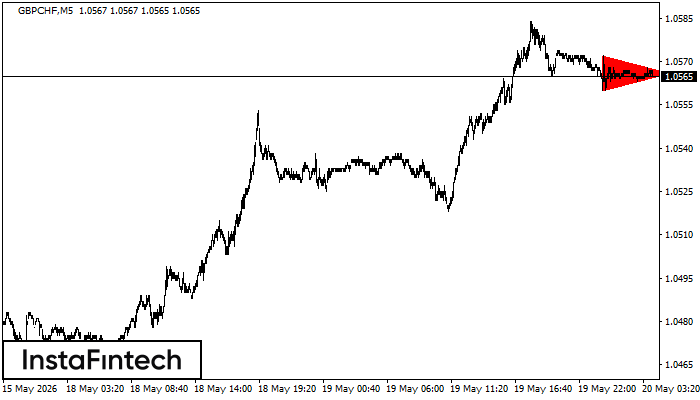
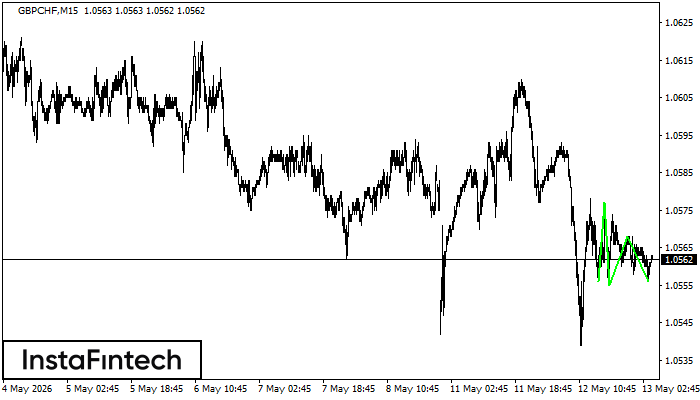
Bearish Symmetrical Triangle
According to the chart of M5, GBPCHF formed the Bearish Symmetrical Triangle pattern. This pattern signals a further downward trend in case the lower border 1.0560 is breached. Here, a hypothetical profit will equal the width of the available pattern that is -12 pips.
GBPCHF M30
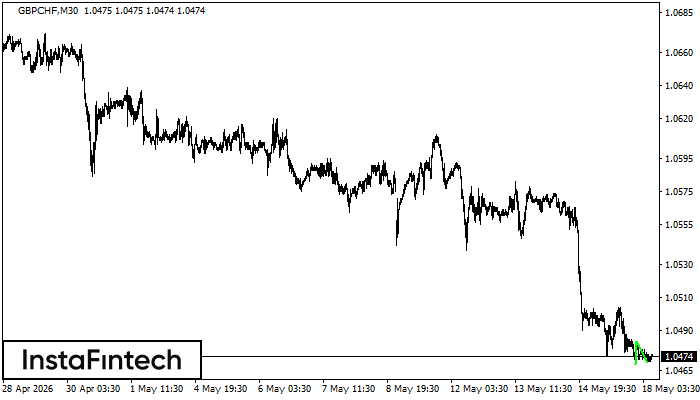
Double Bottom
The Double Bottom pattern has been formed on GBPCHF M30. This formation signals a reversal of the trend from downwards to upwards. The signal is that a buy trade should be opened after the upper boundary of the pattern 1.0483 is broken. The further movements will rely on the width of the current pattern 14 points.
GBPCHF M5
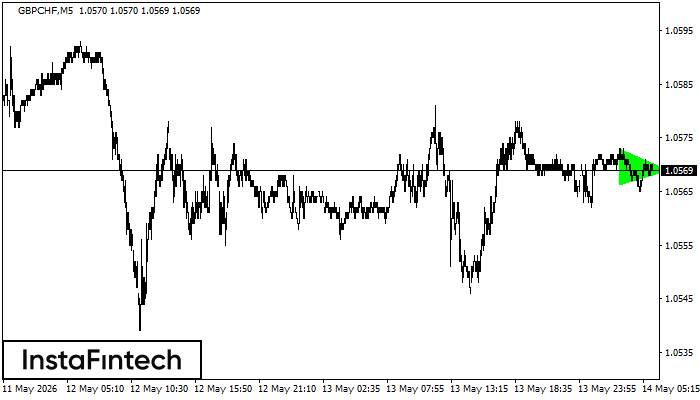
Bullish Symmetrical Triangle
According to the chart of M5, GBPCHF formed the Bullish Symmetrical Triangle pattern, which signals the trend will continue. Description. The upper border of the pattern touches the coordinates 1.0573/1.0569 whereas the lower border goes across 1.0566/1.0569. The pattern width is measured on the chart at 7 pips. If the Bullish Symmetrical Triangle pattern is in progress during the upward trend, this indicates the current trend will go on. In case 1.0569 is broken, the price could continue its move toward 1.0584.
GBPCHF M5
Triple Bottom
The Triple Bottom pattern has formed on the chart of the GBPCHF M5 trading instrument. The pattern signals a change in the trend from downwards to upwards in the case of breakdown of 1.0572/1.0570.
GBPCHF M15
Triple Bottom
The Triple Bottom pattern has formed on the chart of the GBPCHF M15 trading instrument. The pattern signals a change in the trend from downwards to upwards in the case of breakdown of 1.0577/1.0568.
GBPCHF M5
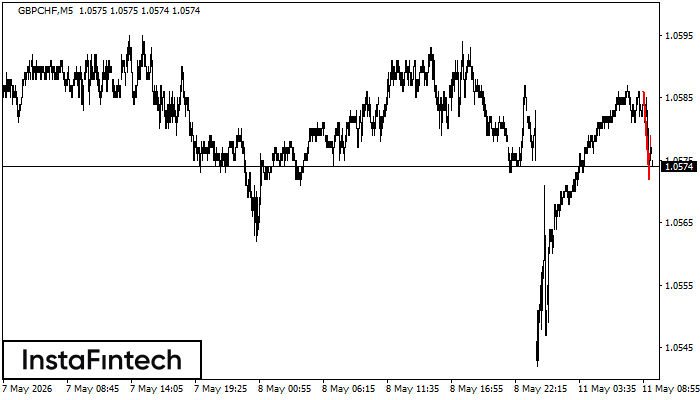
Bearish Flag
The Bearish Flag pattern has been formed on the chart GBPCHF M5. Therefore, the downwards trend is likely to continue in the nearest term. As soon as the price breaks below the low at 1.0572, traders should enter the market.

GBPCHF M5
Bearish pennant
The Bearish pennant pattern has formed on the GBPCHF M5 chart. This pattern type is characterized by a slight slowdown after which the price will move in the direction of the original trend. In case the price fixes below the pattern’s low of 1.0572, a trader will be able to successfully enter the sell position.
GBPCHF M15
Double Top
The Double Top pattern has been formed on GBPCHF M15. It signals that the trend has been changed from upwards to downwards. Probably, if the base of the pattern 1.0542 is broken, the downward movement will continue.