 中文
中文  Русский
 English
 Bahasa Indonesia
 Bahasa Malay
 ไทย
ไทย Español
 Deutsch
 Български
 Français
 Tiếng Việt
 বাংলা
বাংলা हिन्दी
 Čeština
 Українська
 Română
FX.co ★ Patterns GOLD | Gold Rate in the Forex market

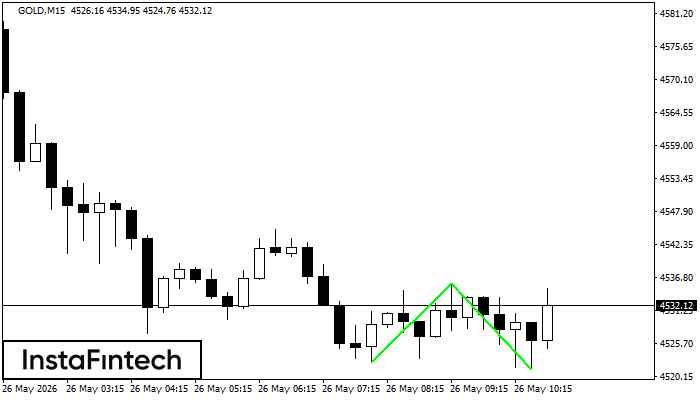
GOLD M15
Double Bottom
The Double Bottom pattern has been formed on GOLD M15. Characteristics: the support level 4522.45; the resistance level 4535.74; the width of the pattern 1329 points. If the resistance level is broken, a change in the trend can be predicted with the first target point lying at the distance of 1449 points.

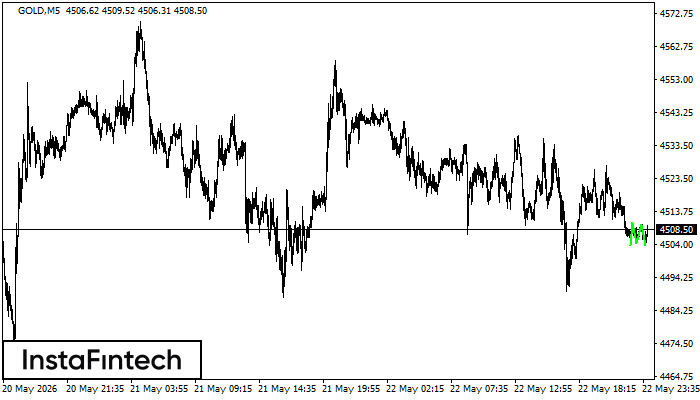
GOLD M5
Double Top
The Double Top reversal pattern has been formed on GOLD M5. Characteristics: the upper boundary 4579.60; the lower boundary 4565.37; the width of the pattern is 1375 points. Sell trades are better to be opened below the lower boundary 4565.37 with a possible movements towards the 4565.22 level.

GOLD M5
Triple Bottom
The Triple Bottom pattern has been formed on GOLD M5. It has the following characteristics: resistance level 4510.43/4510.08; support level 4503.84/4503.72; the width is 659 points. In the event of a breakdown of the resistance level of 4510.43, the price is likely to continue an upward movement at least to 4504.52.
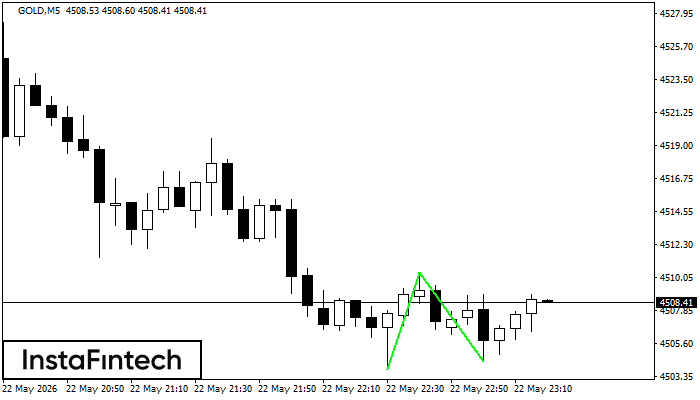
GOLD M5
Triple Bottom
The Triple Bottom pattern has formed on the chart of the GOLD M5 trading instrument. The pattern signals a change in the trend from downwards to upwards in the case of breakdown of 4510.43/4510.08.
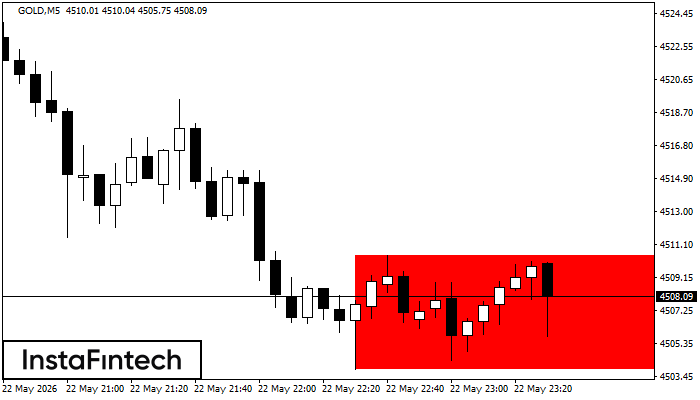
GOLD M5
Bearish Rectangle
According to the chart of M5, GOLD formed the Bearish Rectangle. The pattern indicates a trend continuation. The upper border is 4510.43, the lower border is 4503.84. The signal means that a short position should be opened after fixing a price below the lower border 4503.84 of the Bearish Rectangle.
GOLD M5
Double Bottom
The Double Bottom pattern has been formed on GOLD M5. Characteristics: the support level 4503.84; the resistance level 4510.43; the width of the pattern 659 points. If the resistance level is broken, a change in the trend can be predicted with the first target point lying at the distance of 606 points.
GOLD H1
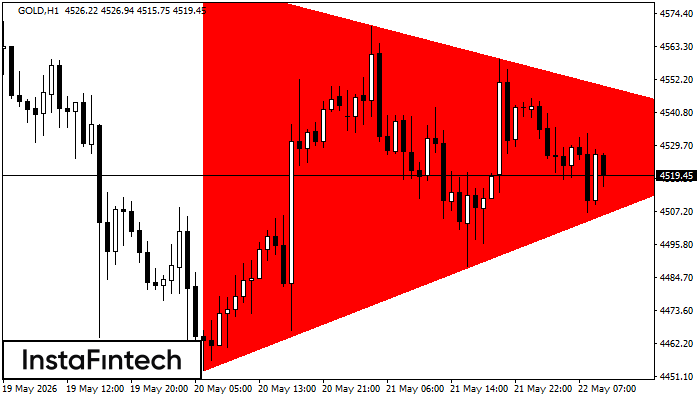
Bearish Symmetrical Triangle
According to the chart of H1, GOLD formed the Bearish Symmetrical Triangle pattern. Description: The lower border is 4453.23/4532.24 and upper border is 4585.38/4532.24. The pattern width is measured on the chart at -13215 pips. The formation of the Bearish Symmetrical Triangle pattern evidently signals a continuation of the downward trend. In other words, if the scenario comes true and GOLD breaches the lower border, the price could continue its move toward 4531.84.
GOLD M5
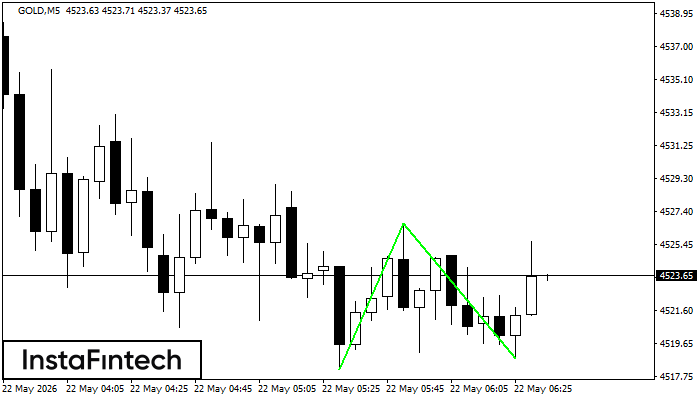
Double Bottom
The Double Bottom pattern has been formed on GOLD M5; the upper boundary is 4526.66; the lower boundary is 4518.80. The width of the pattern is 849 points. In case of a break of the upper boundary 4526.66, a change in the trend can be predicted where the width of the pattern will coincide with the distance to a possible take profit level.
GOLD H1
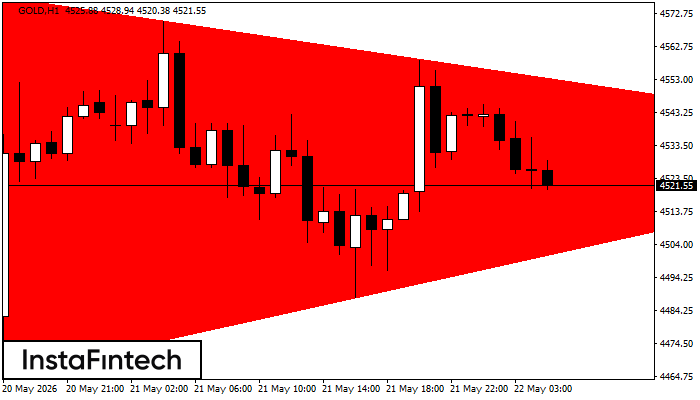
Bearish Symmetrical Triangle
According to the chart of H1, GOLD formed the Bearish Symmetrical Triangle pattern. Trading recommendations: A breach of the lower border 4453.23 is likely to encourage a continuation of the downward trend.
GOLD M5
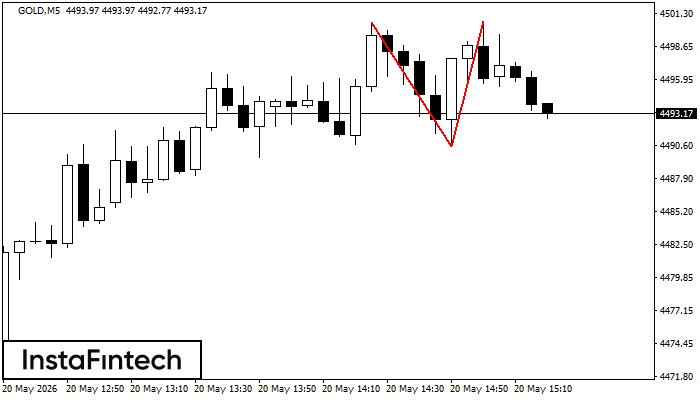
Double Top
On the chart of GOLD M5 the Double Top reversal pattern has been formed. Characteristics: the upper boundary 4500.64; the lower boundary 4490.47; the width of the pattern 1017 points. The signal: a break of the lower boundary will cause continuation of the downward trend targeting the 4490.32 level.