 中文
中文  Русский
 English
 Bahasa Indonesia
 Bahasa Malay
 ไทย
ไทย Español
 Deutsch
 Български
 Français
 Tiếng Việt
 বাংলা
বাংলা हिन्दी
 Čeština
 Українська
 Română
FX.co ★ Patterns #MA | Mastercard IncorpoRated Stock Price

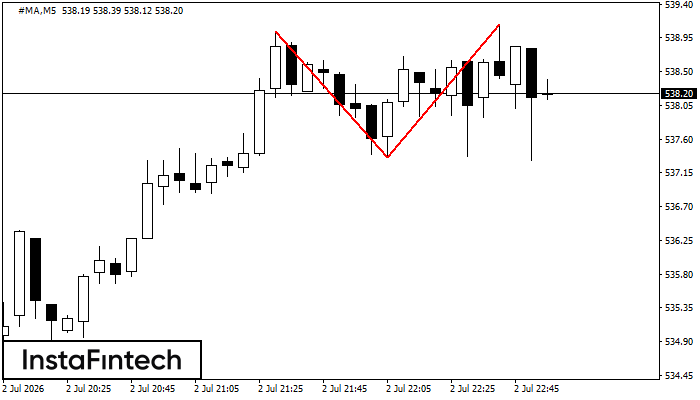
#MA M5
Double Top
On the chart of #MA M5 the Double Top reversal pattern has been formed. Characteristics: the upper boundary 539.12; the lower boundary 537.35; the width of the pattern 177 points. The signal: a break of the lower boundary will cause continuation of the downward trend targeting the 537.20 level.
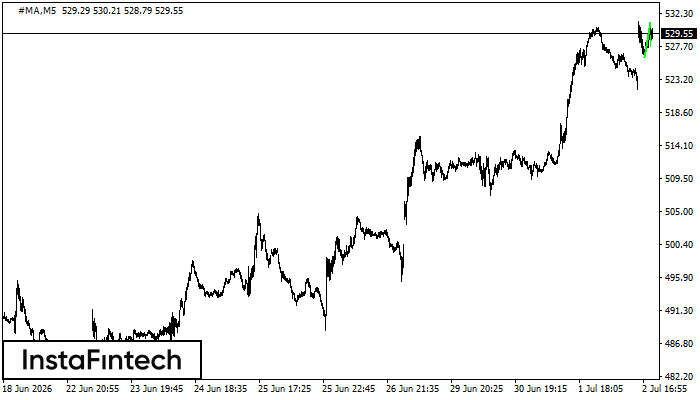
#MA M5
Bullish pennant
The Bullish pennant pattern is formed on the #MA M5 chart. It is a type of the continuation pattern. Supposedly, in case the price is fixed above the pennant’s high of 531.03, a further uptrend is possible.
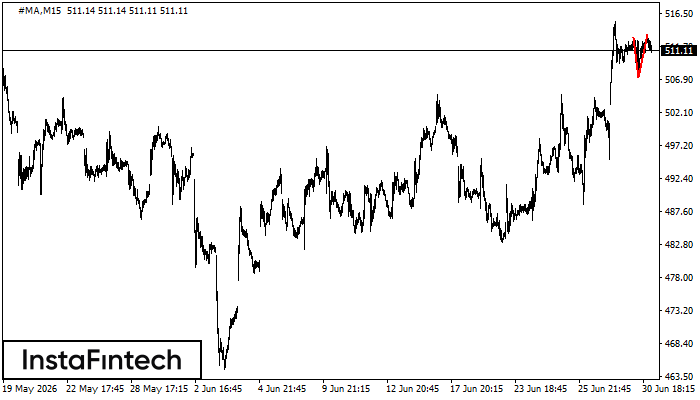
#MA M15
Double Top
The Double Top pattern has been formed on #MA M15. It signals that the trend has been changed from upwards to downwards. Probably, if the base of the pattern 507.15 is broken, the downward movement will continue.
#MA M15
Bullish pennant
The Bullish pennant signal – Trading instrument #MA M15, continuation pattern. Forecast: it is possible to set up a buy position above the pattern’s high of 515.33, with the prospect of the next move being a projection of the flagpole height.
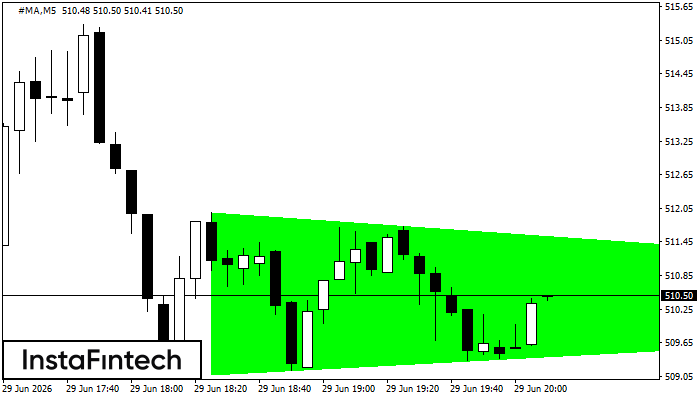
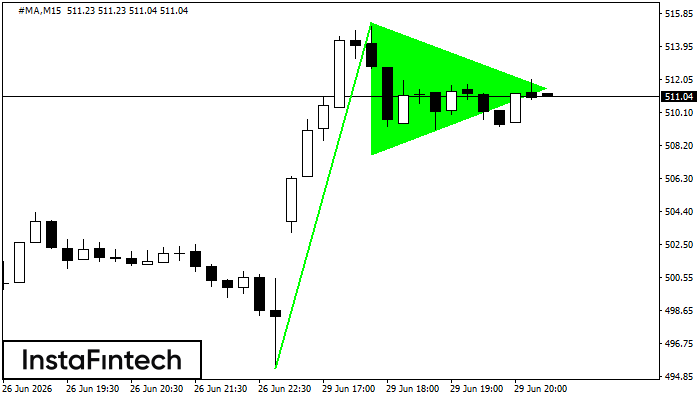
#MA M5
Bullish Symmetrical Triangle
According to the chart of M5, #MA formed the Bullish Symmetrical Triangle pattern, which signals the trend will continue. Description. The upper border of the pattern touches the coordinates 511.97/510.34 whereas the lower border goes across 509.08/510.34. The pattern width is measured on the chart at 289 pips. If the Bullish Symmetrical Triangle pattern is in progress during the upward trend, this indicates the current trend will go on. In case 510.34 is broken, the price could continue its move toward 510.49.
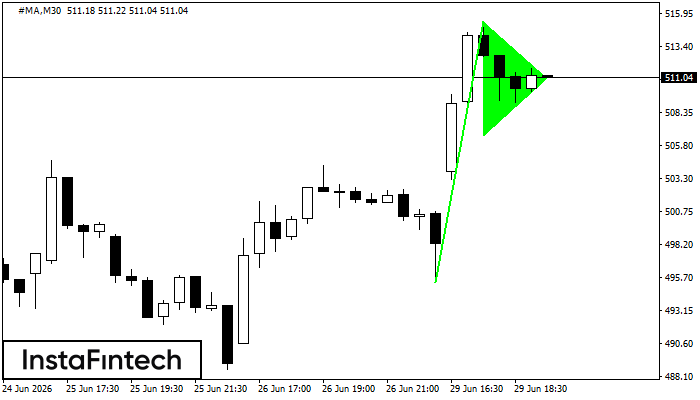
#MA M30
Bullish pennant
The Bullish pennant signal – Trading instrument #MA M30, continuation pattern. Forecast: it is possible to set up a buy position above the pattern’s high of 515.33, with the prospect of the next move being a projection of the flagpole height.
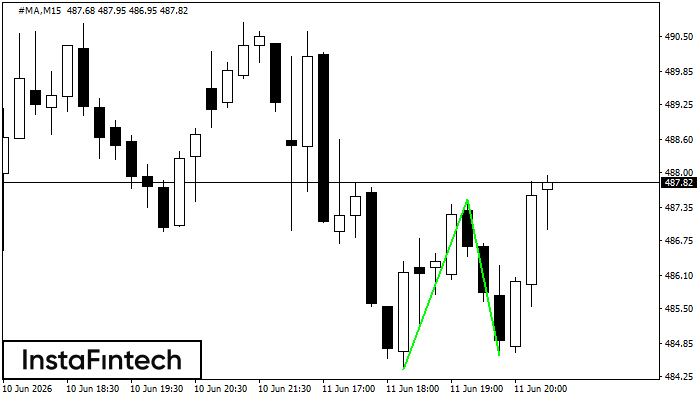
#MA M15
Double Bottom
The Double Bottom pattern has been formed on #MA M15. Characteristics: the support level 484.37; the resistance level 487.50; the width of the pattern 313 points. If the resistance level is broken, a change in the trend can be predicted with the first target point lying at the distance of 287 points.
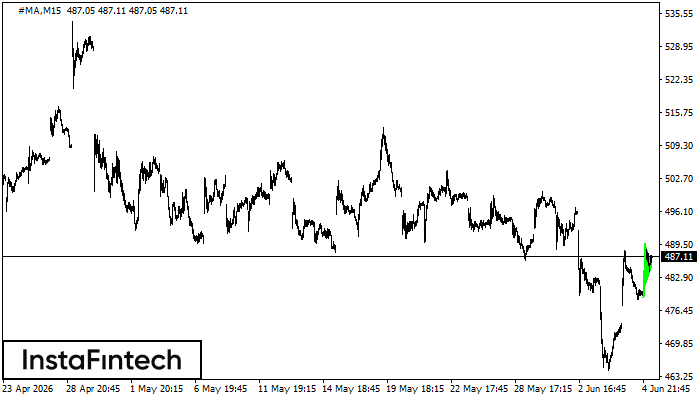
#MA M15
Bullish pennant
The Bullish pennant pattern is formed on the #MA M15 chart. It is a type of the continuation pattern. Supposedly, in case the price is fixed above the pennant’s high of 489.70, a further uptrend is possible.
#MA M5
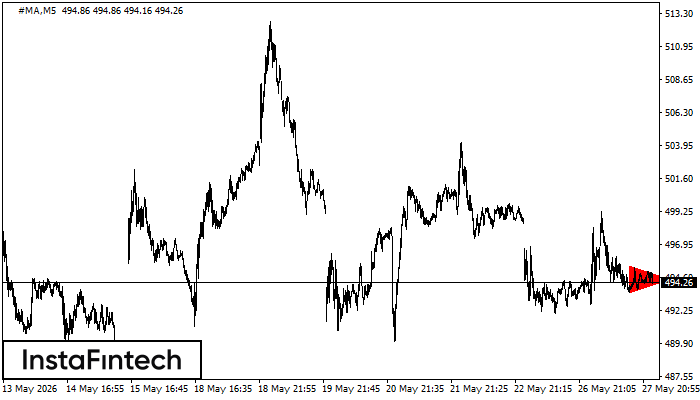
Bearish Symmetrical Triangle
According to the chart of M5, #MA formed the Bearish Symmetrical Triangle pattern. Description: The lower border is 493.54/494.48 and upper border is 495.44/494.48. The pattern width is measured on the chart at -190 pips. The formation of the Bearish Symmetrical Triangle pattern evidently signals a continuation of the downward trend. In other words, if the scenario comes true and #MA breaches the lower border, the price could continue its move toward 494.33.
#MA M5
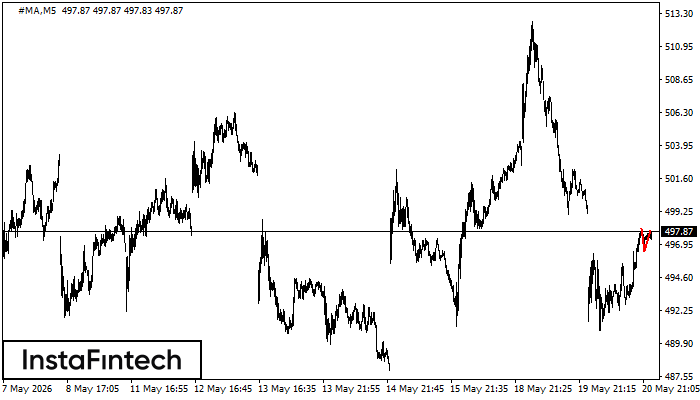
Double Top
On the chart of #MA M5 the Double Top reversal pattern has been formed. Characteristics: the upper boundary 497.96; the lower boundary 496.46; the width of the pattern 150 points. The signal: a break of the lower boundary will cause continuation of the downward trend targeting the 496.31 level.