 中文
中文  Русский
 English
 Bahasa Indonesia
 Bahasa Malay
 ไทย
ไทย Español
 Deutsch
 Български
 Français
 Tiếng Việt
 বাংলা
বাংলা हिन्दी
 Čeština
 Українська
 Română
FX.co ★ Patterns #MSFT | Microsoft Corporation Stock Price

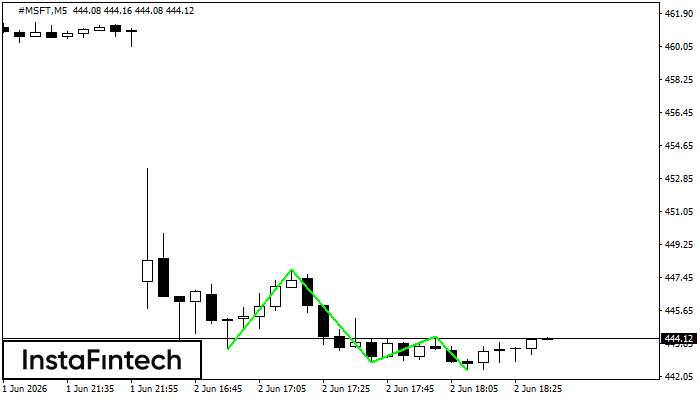
#MSFT M5
Triple Bottom
The Triple Bottom pattern has formed on the chart of #MSFT M5. Features of the pattern: The lower line of the pattern has coordinates 447.90 with the upper limit 447.90/444.22, the projection of the width is 438 points. The formation of the Triple Bottom pattern most likely indicates a change in the trend from downward to upward. This means that in the event of a breakdown of the resistance level 443.52, the price is most likely to continue the upward movement.

#MSFT M5
Bullish Symmetrical Triangle
According to the chart of M5, #MSFT formed the Bullish Symmetrical Triangle pattern. Description: This is the pattern of a trend continuation. 445.61 and 441.69 are the coordinates of the upper and lower borders respectively. The pattern width is measured on the chart at 392 pips. Outlook: If the upper border 445.61 is broken, the price is likely to continue its move by 443.63.
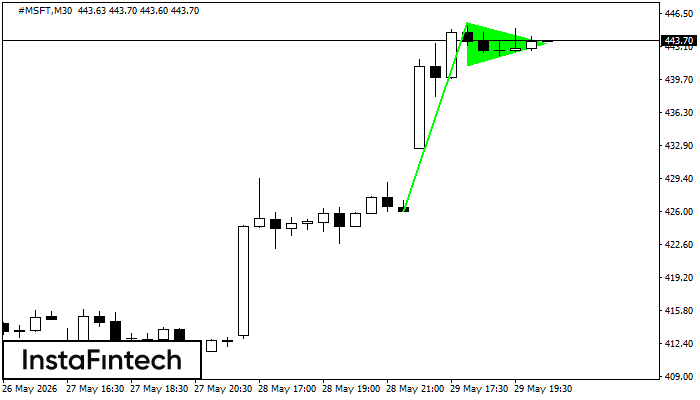
#MSFT M30
Bullish pennant
The Bullish pennant graphic pattern has formed on the #MSFT M30 instrument. This pattern type falls under the category of continuation patterns. In this case, if the quote can breaks out high, is expected to continue the upward trend to level 445.91.
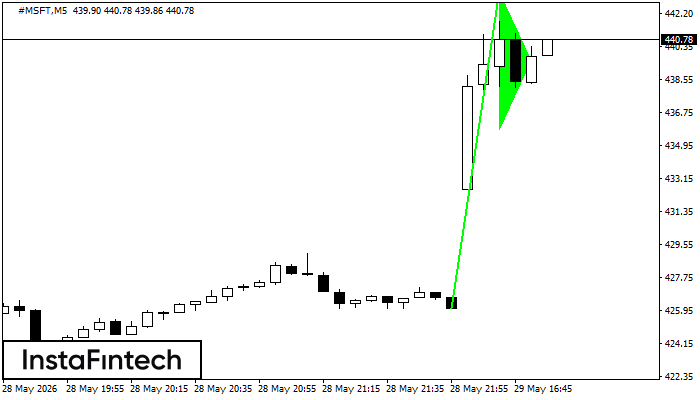
#MSFT M5
Bullish pennant
The Bullish pennant signal – Trading instrument #MSFT M5, continuation pattern. Forecast: it is possible to set up a buy position above the pattern’s high of 443.36, with the prospect of the next move being a projection of the flagpole height.
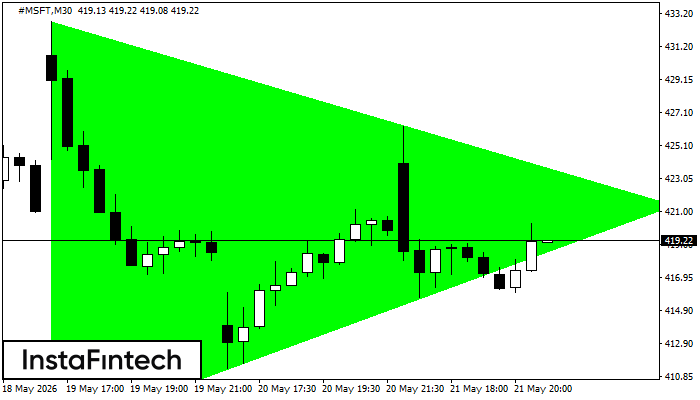
#MSFT M30
Bullish Symmetrical Triangle
According to the chart of M30, #MSFT formed the Bullish Symmetrical Triangle pattern. The lower border of the pattern touches the coordinates 407.31/421.41 whereas the upper border goes across 432.72/421.41. If the Bullish Symmetrical Triangle pattern is in progress, this evidently signals a further upward trend. In other words, in case the scenario comes true, the price of #MSFT will breach the upper border to head for 421.71.
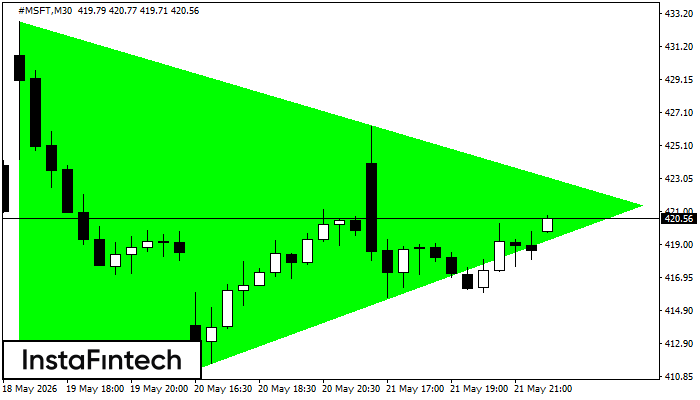
#MSFT M30
Bullish Symmetrical Triangle
According to the chart of M30, #MSFT formed the Bullish Symmetrical Triangle pattern. Description: This is the pattern of a trend continuation. 432.72 and 407.31 are the coordinates of the upper and lower borders respectively. The pattern width is measured on the chart at 2541 pips. Outlook: If the upper border 432.72 is broken, the price is likely to continue its move by 421.71.
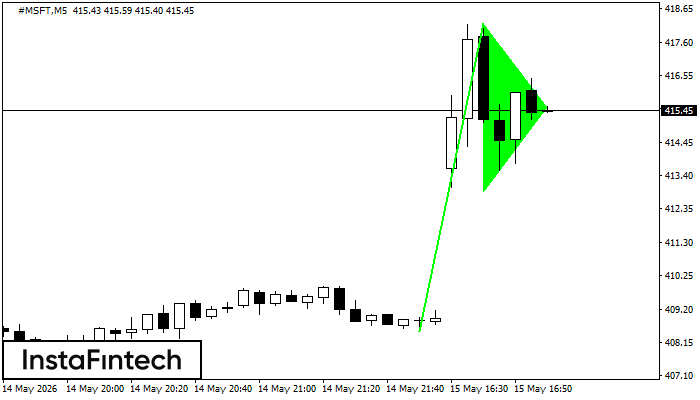
#MSFT M5
Double Bottom
The Double Bottom pattern has been formed on #MSFT M5. Characteristics: the support level 417.12; the resistance level 419.45; the width of the pattern 233 points. If the resistance level is broken, a change in the trend can be predicted with the first target point lying at the distance of 223 points.
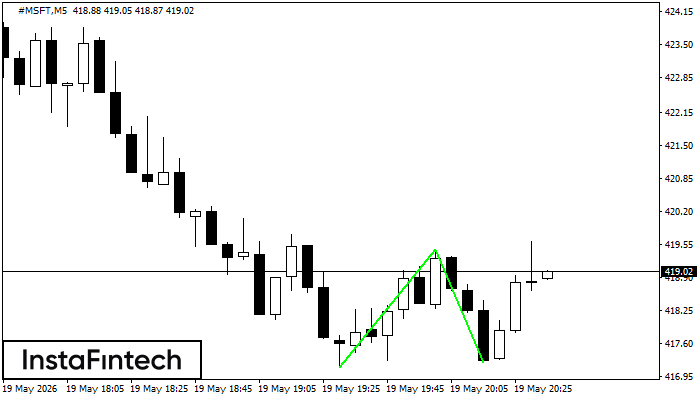
#MSFT M5
Bullish pennant
The Bullish pennant signal – Trading instrument #MSFT M5, continuation pattern. Forecast: it is possible to set up a buy position above the pattern’s high of 418.18, with the prospect of the next move being a projection of the flagpole height.
#MSFT M5
Triple Bottom
The Triple Bottom pattern has formed on the chart of #MSFT M5. Features of the pattern: The lower line of the pattern has coordinates 411.56 with the upper limit 411.56/410.41, the projection of the width is 217 points. The formation of the Triple Bottom pattern most likely indicates a change in the trend from downward to upward. This means that in the event of a breakdown of the resistance level 409.39, the price is most likely to continue the upward movement.
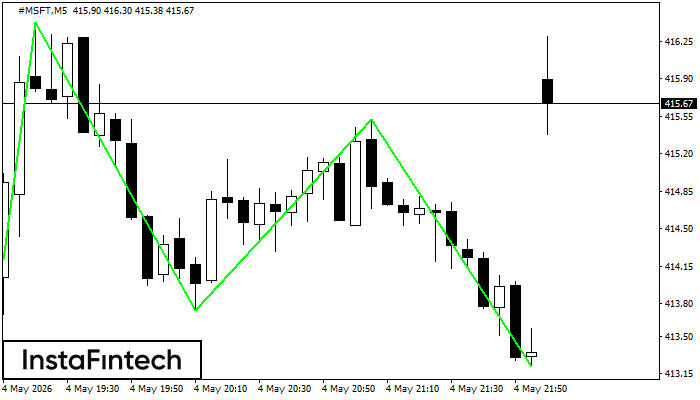
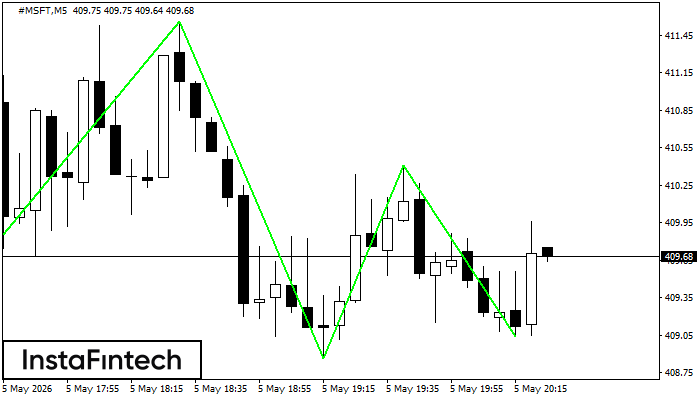
#MSFT M5
Triple Bottom
The Triple Bottom pattern has been formed on #MSFT M5. It has the following characteristics: resistance level 416.43/415.52; support level 413.11/413.22; the width is 332 points. In the event of a breakdown of the resistance level of 416.43, the price is likely to continue an upward movement at least to 413.89.