 中文
中文  Русский
 English
 Bahasa Indonesia
 Bahasa Malay
 ไทย
ไทย Español
 Deutsch
 Български
 Français
 Tiếng Việt
 বাংলা
বাংলা हिन्दी
 Čeština
 Українська
 Română
FX.co ★ Patterns NZDCAD | New Zealand Dollar (NZD) to Canadian Dollar (CAD) Rate in the Forex market


NZDCAD M15
Double Top
On the chart of NZDCAD M15 the Double Top reversal pattern has been formed. Characteristics: the upper boundary 0.8112; the lower boundary 0.8107; the width of the pattern 5 points. The signal: a break of the lower boundary will cause continuation of the downward trend targeting the 0.8084 level.

NZDCAD M15
Double Top
The Double Top reversal pattern has been formed on NZDCAD M15. Characteristics: the upper boundary 0.8112; the lower boundary 0.8099; the width of the pattern is 13 points. Sell trades are better to be opened below the lower boundary 0.8099 with a possible movements towards the 0.8077 level.
NZDCAD M5
Double Top
The Double Top reversal pattern has been formed on NZDCAD M5. Characteristics: the upper boundary 0.8089; the lower boundary 0.8067; the width of the pattern is 23 points. Sell trades are better to be opened below the lower boundary 0.8067 with a possible movements towards the 0.8052 level.
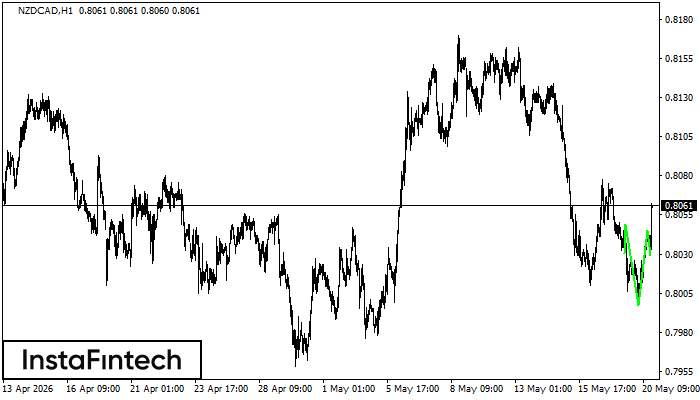
NZDCAD H1
Inverse Head and Shoulder
According to H1, NZDCAD is shaping the technical pattern – the Inverse Head and Shoulder. In case the Neckline 0.8049/0.8045 is broken out, the instrument is likely to move toward 0.8085.
NZDCAD M30
Inverse Head and Shoulder
According to the chart of M30, NZDCAD formed the Inverse Head and Shoulder pattern. The Head’s top is set at 0.8045 while the median line of the Neck is found at 0.7997/0.8029. The formation of the Inverse Head and Shoulder pattern evidently signals a reversal of the downward trend. In other words, in case the scenario comes true, the price of NZDCAD will go towards 0.8075
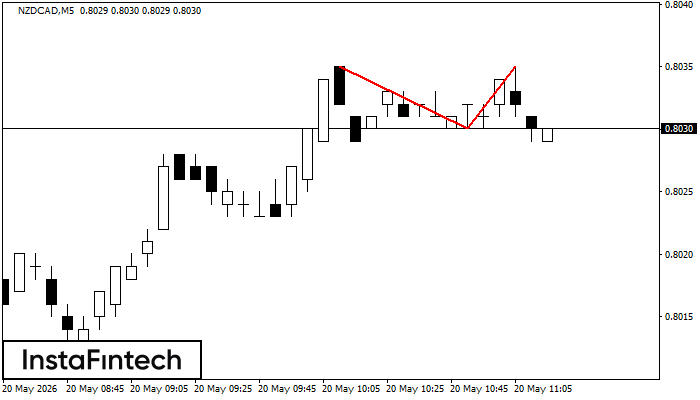
NZDCAD M5
Double Top
The Double Top reversal pattern has been formed on NZDCAD M5. Characteristics: the upper boundary 0.8035; the lower boundary 0.8030; the width of the pattern is 5 points. Sell trades are better to be opened below the lower boundary 0.8030 with a possible movements towards the 0.8015 level.
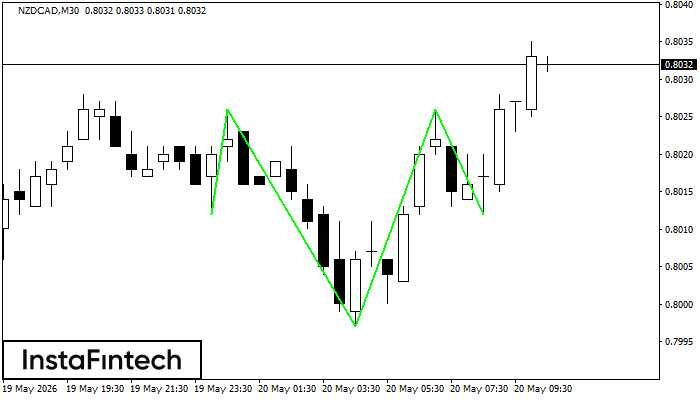
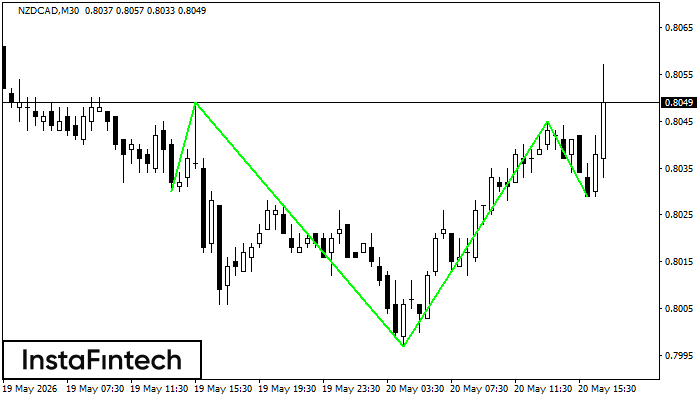
NZDCAD M30
Inverse Head and Shoulder
According to the chart of M30, NZDCAD produced the pattern termed the Inverse Head and Shoulder. The Head is fixed at 0.7997 while the median line of the Neck is set at 0.8026/0.8026. The formation of the Inverse Head and Shoulder Pattern clearly indicates a reversal of the downward trend. In means that in case the scenario comes true, the price of NZDCAD will go towards 0.8056.
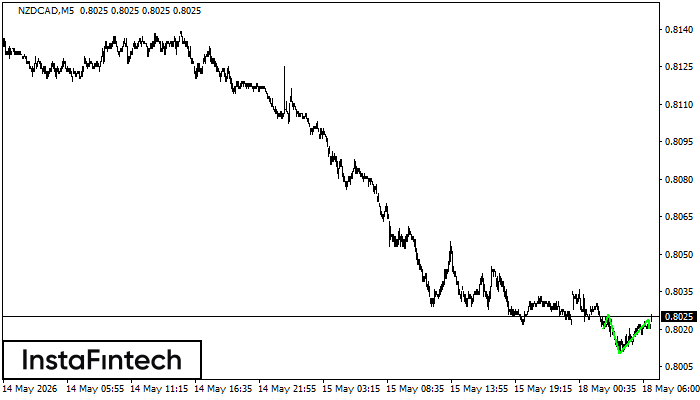
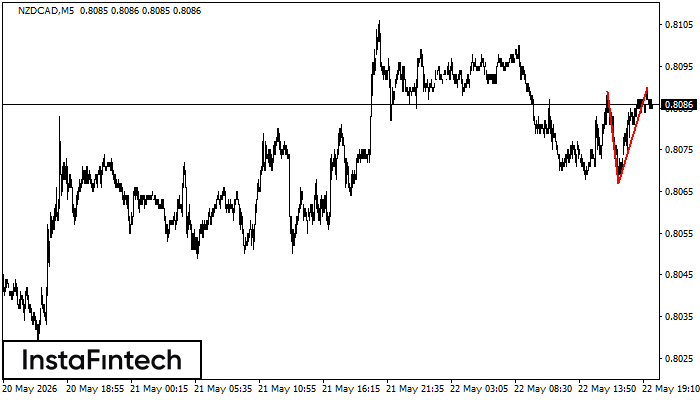
NZDCAD M5
Inverse Head and Shoulder
According to M5, NZDCAD is shaping the technical pattern – the Inverse Head and Shoulder. In case the Neckline 0.8026/0.8024 is broken out, the instrument is likely to move toward 0.8039.
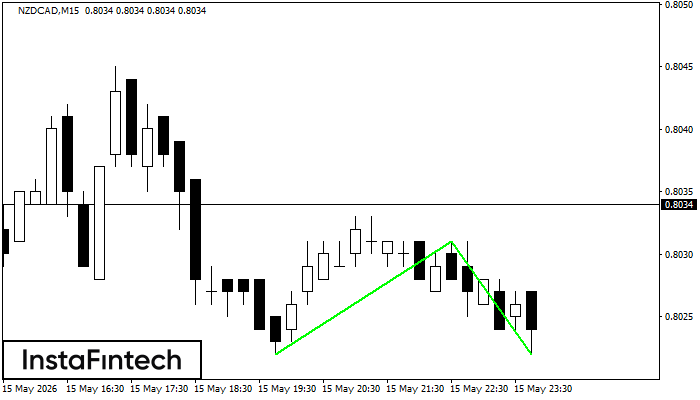
NZDCAD M15
Double Bottom
The Double Bottom pattern has been formed on NZDCAD M15. Characteristics: the support level 0.8022; the resistance level 0.8031; the width of the pattern 9 points. If the resistance level is broken, a change in the trend can be predicted with the first target point lying at the distance of 9 points.