 中文
中文  Русский
 English
 Bahasa Indonesia
 Bahasa Malay
 ไทย
ไทย Español
 Deutsch
 Български
 Français
 Tiếng Việt
 বাংলা
বাংলা हिन्दी
 Čeština
 Українська
 Română
FX.co ★ Patterns NZDUSD | New Zealand Dollar (NZD) to US Dollar (USD) Rate in the Forex market


NZDUSD M30
Bullish Rectangle
According to the chart of M30, NZDUSD formed the Bullish Rectangle. This type of a pattern indicates a trend continuation. It consists of two levels: resistance 0.5876 and support 0.5864. In case the resistance level 0.5876 - 0.5876 is broken, the instrument is likely to follow the bullish trend.

NZDUSD M15
Bullish Rectangle
According to the chart of M15, NZDUSD formed the Bullish Rectangle which is a pattern of a trend continuation. The pattern is contained within the following borders: the lower border 0.5864 – 0.5864 and upper border 0.5876 – 0.5876. In case the upper border is broken, the instrument is likely to follow the upward trend.

NZDUSD M30
Bullish pennant
The Bullish pennant pattern is formed on the NZDUSD M30 chart. It is a type of the continuation pattern. Supposedly, in case the price is fixed above the pennant’s high of 0.5875, a further uptrend is possible.

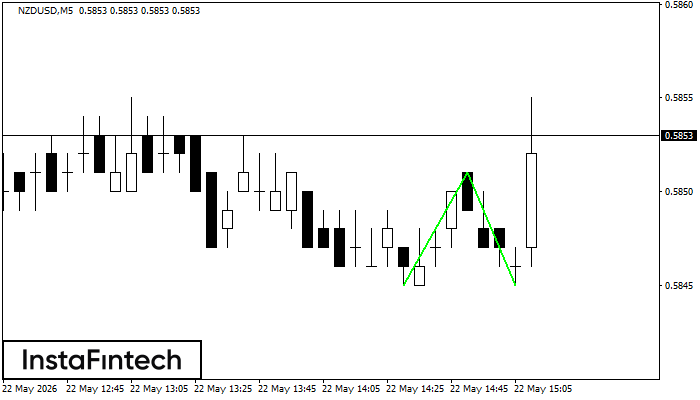
NZDUSD M5
Triple Top
The Triple Top pattern has formed on the chart of the NZDUSD M5 trading instrument. It is a reversal pattern featuring the following characteristics: resistance level -3, support level -1, and pattern’s width 8. Forecast If the price breaks through the support level 0.5864, it is likely to move further down to 0.5860.

NZDUSD M5
Double Bottom
The Double Bottom pattern has been formed on NZDUSD M5. This formation signals a reversal of the trend from downwards to upwards. The signal is that a buy trade should be opened after the upper boundary of the pattern 0.5859 is broken. The further movements will rely on the width of the current pattern 20 points.
NZDUSD M5
Double Bottom
The Double Bottom pattern has been formed on NZDUSD M5. Characteristics: the support level 0.5845; the resistance level 0.5851; the width of the pattern 6 points. If the resistance level is broken, a change in the trend can be predicted with the first target point lying at the distance of 6 points.
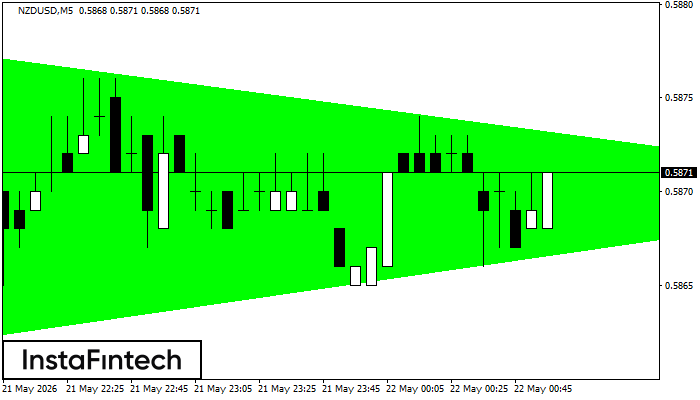
NZDUSD M5
Bullish Symmetrical Triangle
According to the chart of M5, NZDUSD formed the Bullish Symmetrical Triangle pattern. The lower border of the pattern touches the coordinates 0.5861/0.5870 whereas the upper border goes across 0.5878/0.5870. If the Bullish Symmetrical Triangle pattern is in progress, this evidently signals a further upward trend. In other words, in case the scenario comes true, the price of NZDUSD will breach the upper border to head for 0.5885.
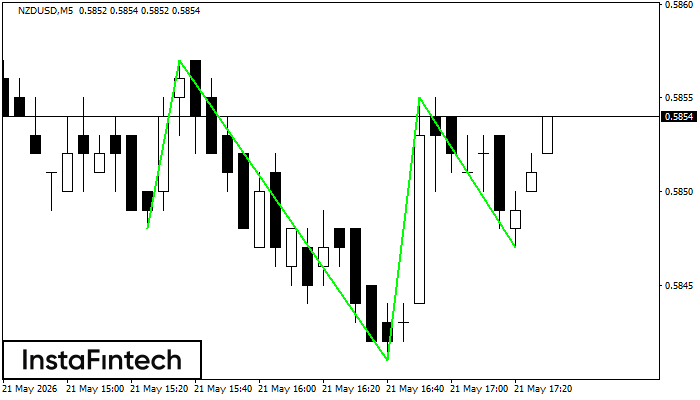
NZDUSD M5
Inverse Head and Shoulder
According to the chart of M5, NZDUSD produced the pattern termed the Inverse Head and Shoulder. The Head is fixed at 0.5841 while the median line of the Neck is set at 0.5857/0.5855. The formation of the Inverse Head and Shoulder Pattern clearly indicates a reversal of the downward trend. In means that in case the scenario comes true, the price of NZDUSD will go towards 0.5870.
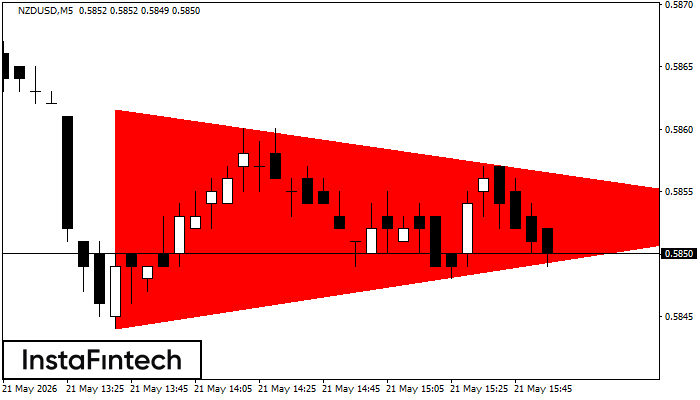
NZDUSD M5
Bearish Symmetrical Triangle
According to the chart of M5, NZDUSD formed the Bearish Symmetrical Triangle pattern. This pattern signals a further downward trend in case the lower border 0.5844 is breached. Here, a hypothetical profit will equal the width of the available pattern that is -18 pips.
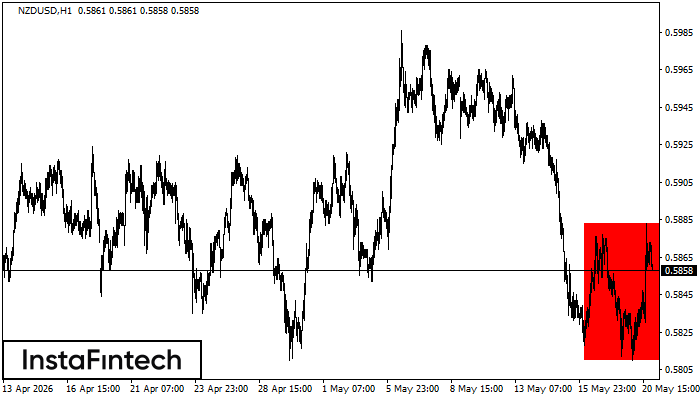
NZDUSD H1
Bearish Rectangle
According to the chart of H1, NZDUSD formed the Bearish Rectangle. This type of a pattern indicates a trend continuation. It consists of two levels: resistance 0.5883 - 0.0000 and support 0.5810 – 0.5810. In case the resistance level 0.5810 - 0.5810 is broken, the instrument is likely to follow the bearish trend.