 中文
中文  Русский
 English
 Bahasa Indonesia
 Bahasa Malay
 ไทย
ไทย Español
 Deutsch
 Български
 Français
 Tiếng Việt
 বাংলা
বাংলা हिन्दी
 Čeština
 Українська
 Română
FX.co ★ Patterns SILVER | Silver Rate in the Forex market

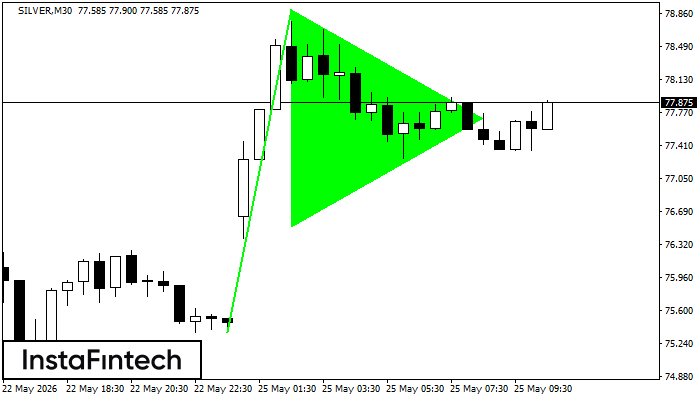
SILVER M30
Bullish pennant
The Bullish pennant signal – Trading instrument SILVER M30, continuation pattern. Forecast: it is possible to set up a buy position above the pattern’s high of 78.89, with the prospect of the next move being a projection of the flagpole height.
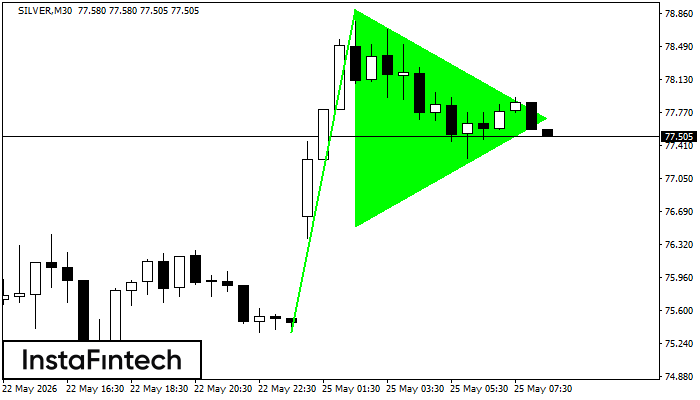
SILVER M30
Bullish pennant
The Bullish pennant graphic pattern has formed on the SILVER M30 instrument. This pattern type falls under the category of continuation patterns. In this case, if the quote can breaks out high, is expected to continue the upward trend to level 78.92.
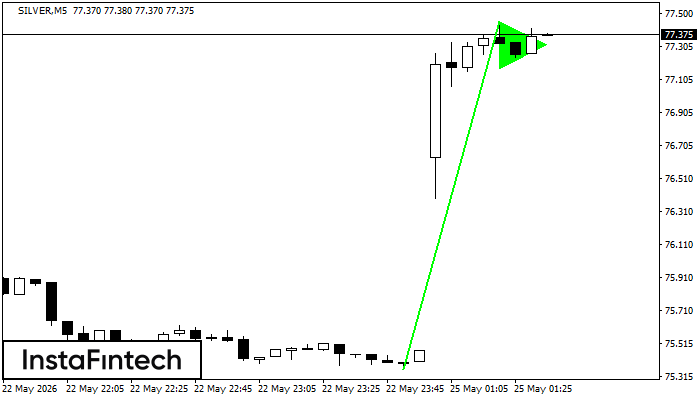
SILVER M5
Bullish pennant
The Bullish pennant signal – Trading instrument SILVER M5, continuation pattern. Forecast: it is possible to set up a buy position above the pattern’s high of 77.45, with the prospect of the next move being a projection of the flagpole height.
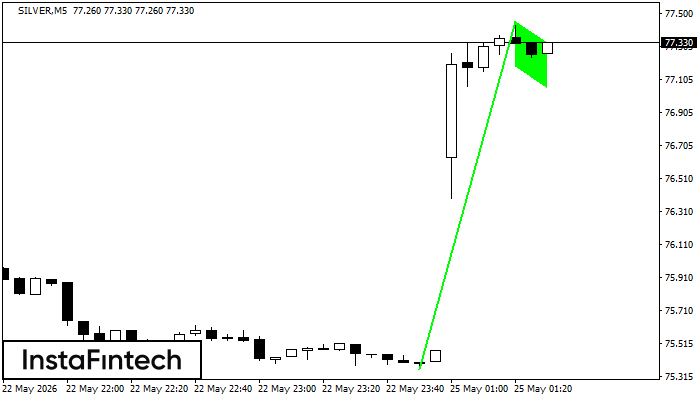
SILVER M5
Bullish Flag
The Bullish Flag pattern which signals continuation of a trend has been formed on the chart SILVER M5. Forecast: if the price breaks above the pattern high at 77.45, then traders will be able to place a long deal with the target at 77.47.
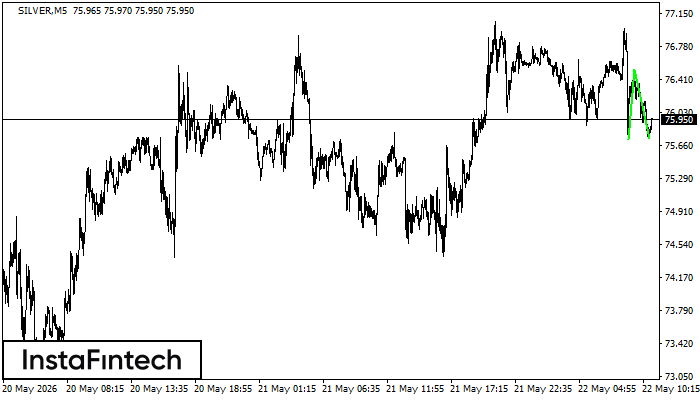
SILVER M5
Double Bottom
The Double Bottom pattern has been formed on SILVER M5. Characteristics: the support level 75.72; the resistance level 76.53; the width of the pattern 800 points. If the resistance level is broken, a change in the trend can be predicted with the first target point lying at the distance of 790 points.
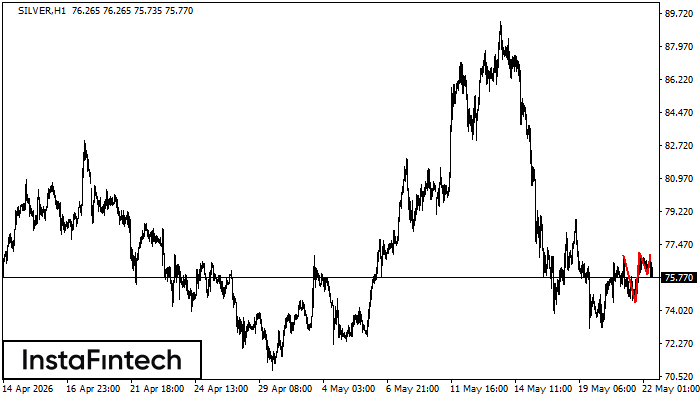
SILVER H1
Triple Top
The Triple Top pattern has formed on the chart of the SILVER H1 trading instrument. It is a reversal pattern featuring the following characteristics: resistance level -80, support level -1480, and pattern’s width 2495. Forecast If the price breaks through the support level 74.41, it is likely to move further down to 77.02.
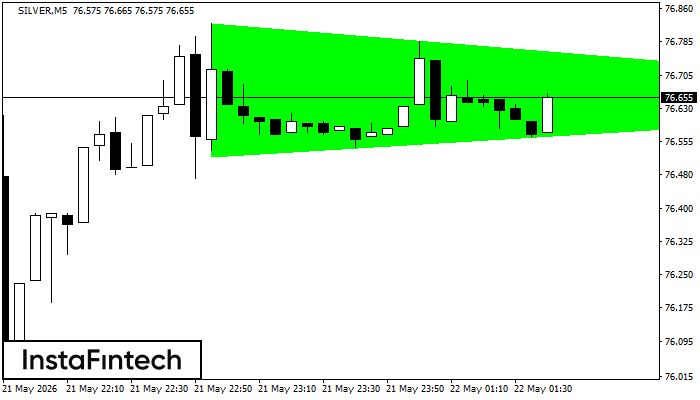
SILVER M5
Bullish Symmetrical Triangle
According to the chart of M5, SILVER formed the Bullish Symmetrical Triangle pattern. Description: This is the pattern of a trend continuation. 76.83 and 76.52 are the coordinates of the upper and lower borders respectively. The pattern width is measured on the chart at 305 pips. Outlook: If the upper border 76.83 is broken, the price is likely to continue its move by 76.66.
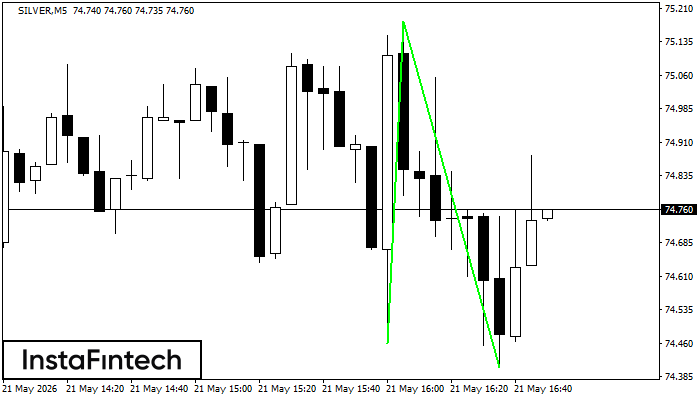
SILVER M5
Double Bottom
The Double Bottom pattern has been formed on SILVER M5. This formation signals a reversal of the trend from downwards to upwards. The signal is that a buy trade should be opened after the upper boundary of the pattern 75.18 is broken. The further movements will rely on the width of the current pattern 720 points.
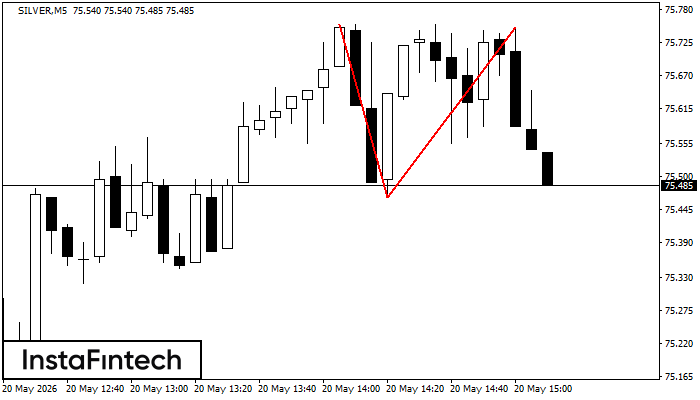
SILVER M5
Bullish Rectangle
According to the chart of M5, SILVER formed the Bullish Rectangle which is a pattern of a trend continuation. The pattern is contained within the following borders: the lower border 75.53 – 75.53 and upper border 76.56 – 76.56. In case the upper border is broken, the instrument is likely to follow the upward trend.
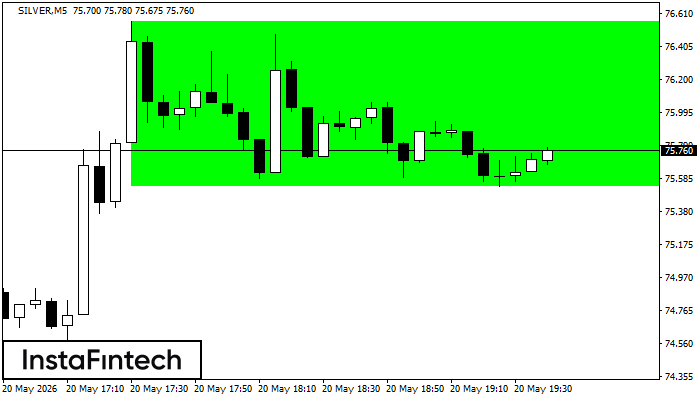
SILVER M5
Double Top
The Double Top pattern has been formed on SILVER M5. It signals that the trend has been changed from upwards to downwards. Probably, if the base of the pattern 75.47 is broken, the downward movement will continue.