 中文
中文  Русский
 English
 Bahasa Indonesia
 Bahasa Malay
 ไทย
ไทย Español
 Deutsch
 Български
 Français
 Tiếng Việt
 বাংলা
বাংলা हिन्दी
 Čeština
 Українська
 Română
FX.co ★ Patterns #TSLA | Tesla, Inc. Stock Price

#TSLA M5
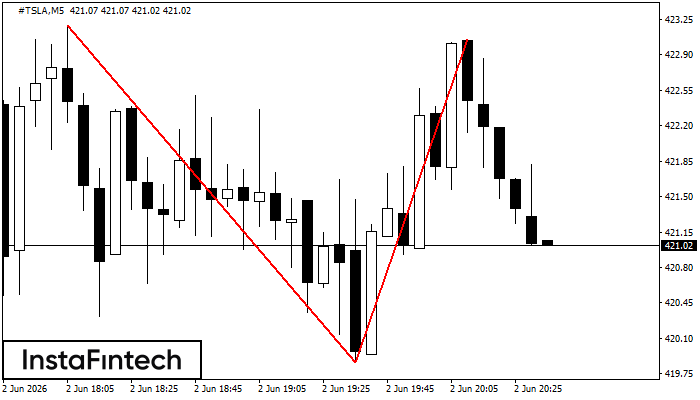
Double Top
On the chart of #TSLA M5 the Double Top reversal pattern has been formed. Characteristics: the upper boundary 423.05; the lower boundary 419.86; the width of the pattern 319 points. The signal: a break of the lower boundary will cause continuation of the downward trend targeting the 419.71 level.
#TSLA M5
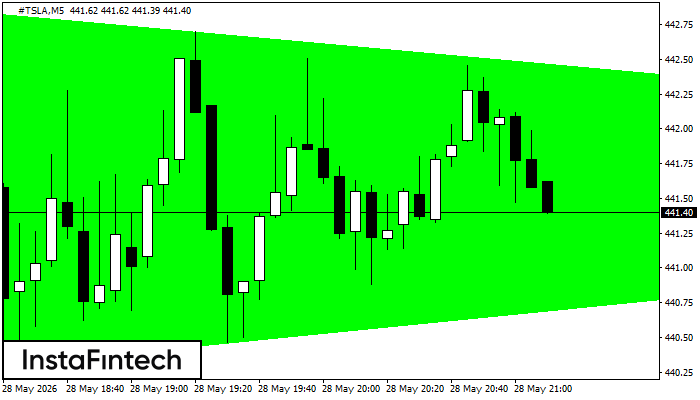
Bullish Symmetrical Triangle
According to the chart of M5, #TSLA formed the Bullish Symmetrical Triangle pattern. The lower border of the pattern touches the coordinates 440.25/441.62 whereas the upper border goes across 442.87/441.62. If the Bullish Symmetrical Triangle pattern is in progress, this evidently signals a further upward trend. In other words, in case the scenario comes true, the price of #TSLA will breach the upper border to head for 441.77.
#TSLA M5
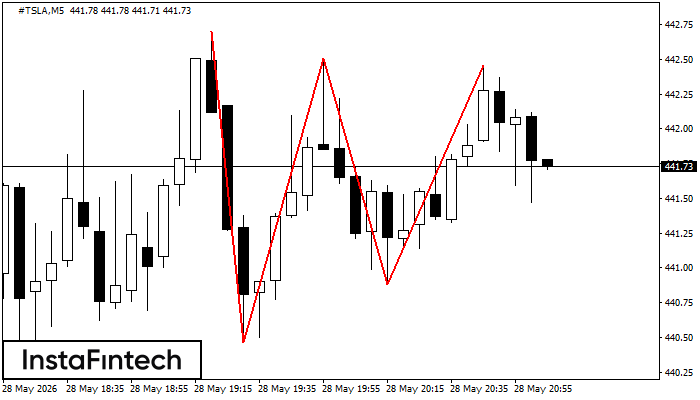
Triple Top
The Triple Top pattern has formed on the chart of the #TSLA M5. Features of the pattern: borders have an ascending angle; the lower line of the pattern has the coordinates 440.46/440.88 with the upper limit 442.70/442.46; the projection of the width is 224 points. The formation of the Triple Top figure most likely indicates a change in the trend from upward to downward. This means that in the event of a breakdown of the support level of 440.46, the price is most likely to continue the downward movement.
#TSLA M5
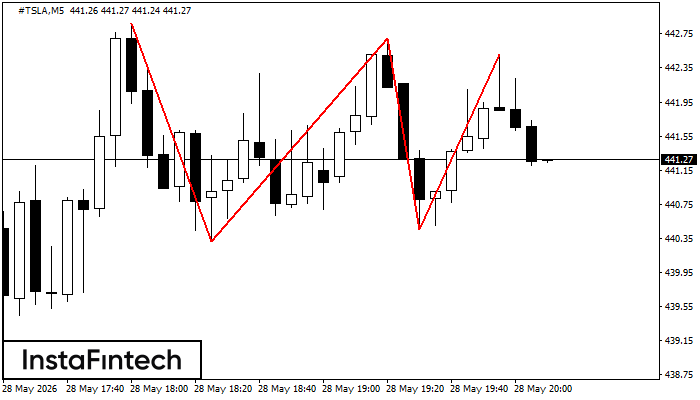
Triple Top
The Triple Top pattern has formed on the chart of the #TSLA M5. Features of the pattern: borders have an ascending angle; the lower line of the pattern has the coordinates 440.31/440.46 with the upper limit 442.87/442.51; the projection of the width is 256 points. The formation of the Triple Top figure most likely indicates a change in the trend from upward to downward. This means that in the event of a breakdown of the support level of 440.31, the price is most likely to continue the downward movement.
#TSLA M5
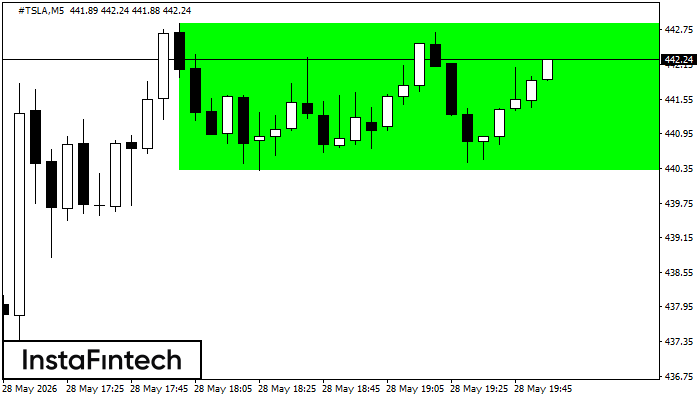
Bullish Rectangle
According to the chart of M5, #TSLA formed the Bullish Rectangle which is a pattern of a trend continuation. The pattern is contained within the following borders: the lower border 440.31 – 440.31 and upper border 442.87 – 442.87. In case the upper border is broken, the instrument is likely to follow the upward trend.
#TSLA M5
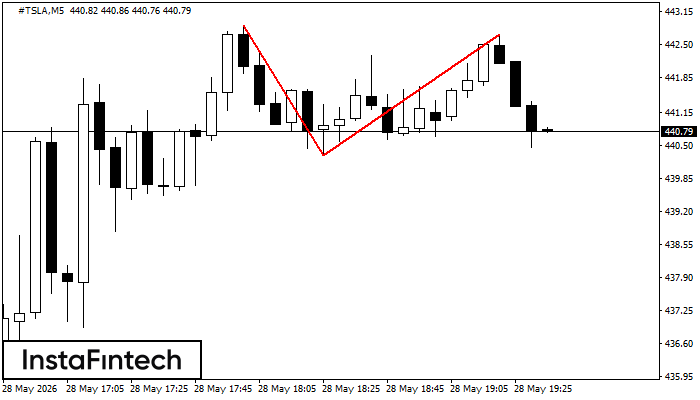
Double Top
On the chart of #TSLA M5 the Double Top reversal pattern has been formed. Characteristics: the upper boundary 442.70; the lower boundary 440.31; the width of the pattern 239 points. The signal: a break of the lower boundary will cause continuation of the downward trend targeting the 440.16 level.
#TSLA M5
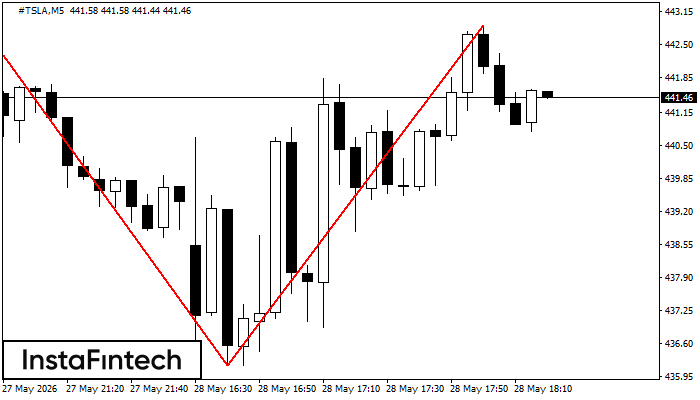
Double Top
On the chart of #TSLA M5 the Double Top reversal pattern has been formed. Characteristics: the upper boundary 442.87; the lower boundary 436.16; the width of the pattern 671 points. The signal: a break of the lower boundary will cause continuation of the downward trend targeting the 436.01 level.
#TSLA M5
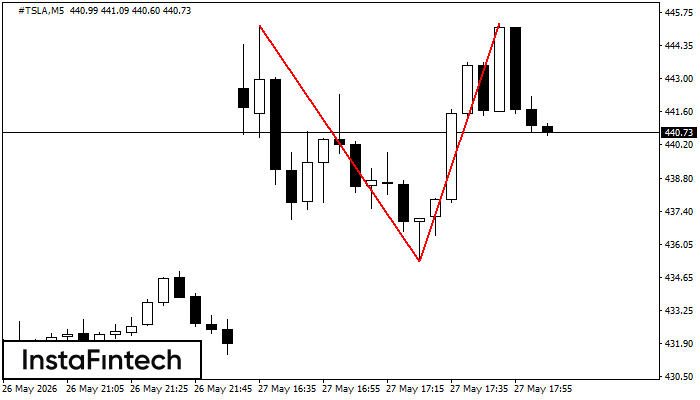
Double Top
On the chart of #TSLA M5 the Double Top reversal pattern has been formed. Characteristics: the upper boundary 445.30; the lower boundary 435.33; the width of the pattern 997 points. The signal: a break of the lower boundary will cause continuation of the downward trend targeting the 435.18 level.
#TSLA M5
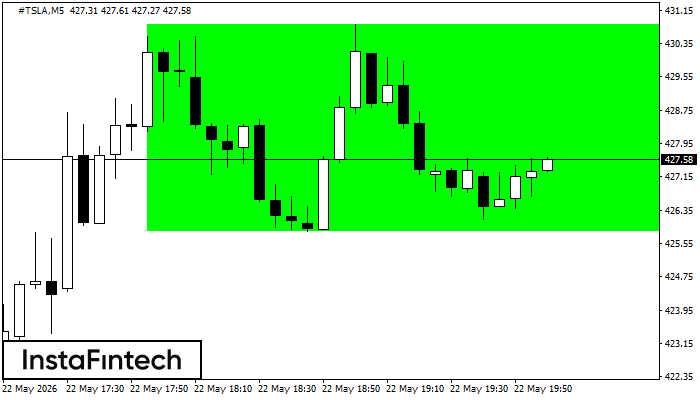
Bullish Rectangle
According to the chart of M5, #TSLA formed the Bullish Rectangle. The pattern indicates a trend continuation. The upper border is 430.80, the lower border is 425.83. The signal means that a long position should be opened above the upper border 430.80 of the Bullish Rectangle.
#TSLA M15
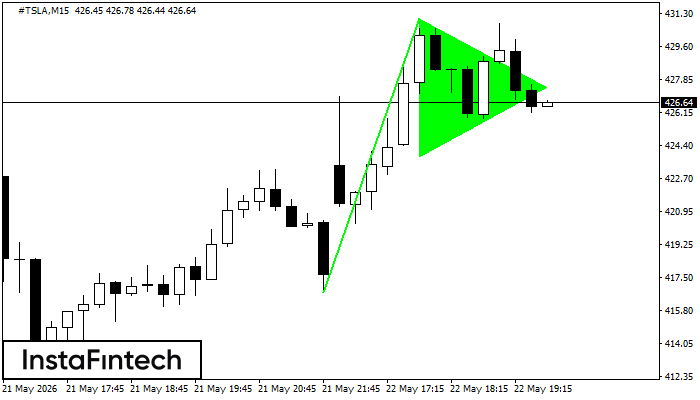
Bullish pennant
The Bullish pennant pattern is formed on the #TSLA M15 chart. It is a type of the continuation pattern. Supposedly, in case the price is fixed above the pennant’s high of 431.06, a further uptrend is possible.