 中文
中文  Русский
 English
 Bahasa Indonesia
 Bahasa Malay
 ไทย
ไทย Español
 Deutsch
 Български
 Français
 Tiếng Việt
 বাংলা
বাংলা हिन्दी
 Čeština
 Українська
 Română
FX.co ★ Patterns USDCAD | US Dollar (USD) to the Canadian Dollar (CAD) Rate in the Forex market


USDCAD M5
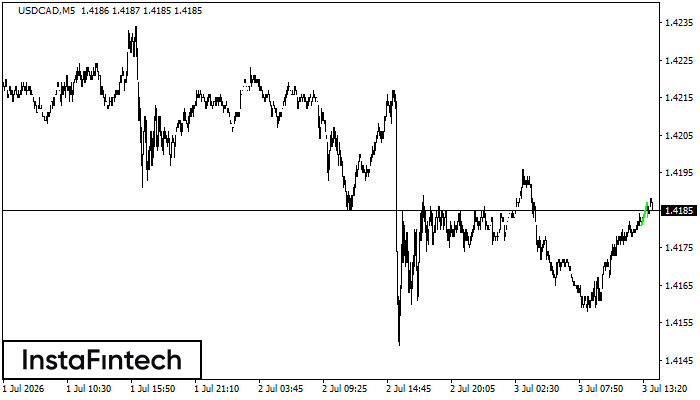
Bullish Flag
The Bullish Flag pattern which signals continuation of a trend has been formed on the chart USDCAD M5. Forecast: if the price breaks above the pattern high at 1.4187, then traders will be able to place a long deal with the target at 1.4202.
USDCAD M5
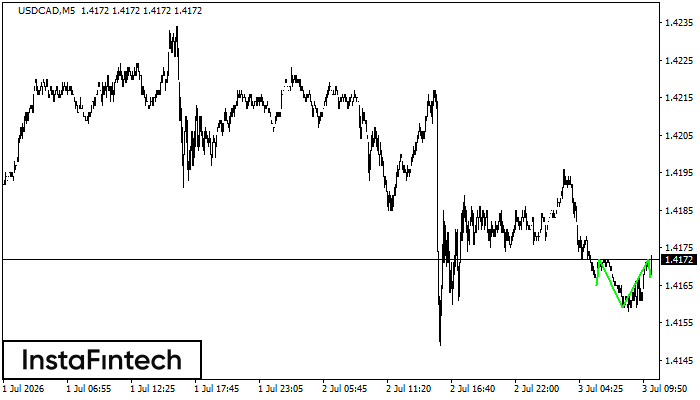
Bullish pennant
The Bullish pennant signal – Trading instrument USDCAD M5, continuation pattern. Forecast: it is possible to set up a buy position above the pattern’s high of 1.4187, with the prospect of the next move being a projection of the flagpole height.
USDCAD M5
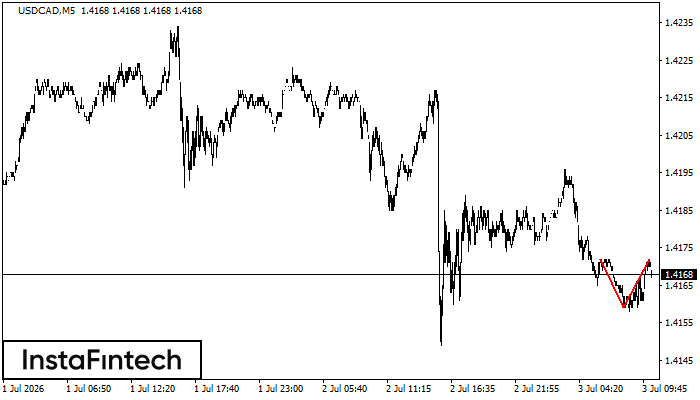
Inverse Head and Shoulder
According to M5, USDCAD is shaping the technical pattern – the Inverse Head and Shoulder. In case the Neckline 1.4172/1.4172 is broken out, the instrument is likely to move toward 1.4187.
USDCAD M5
Double Top
On the chart of USDCAD M5 the Double Top reversal pattern has been formed. Characteristics: the upper boundary 1.4172; the lower boundary 1.4159; the width of the pattern 13 points. The signal: a break of the lower boundary will cause continuation of the downward trend targeting the 1.4144 level.
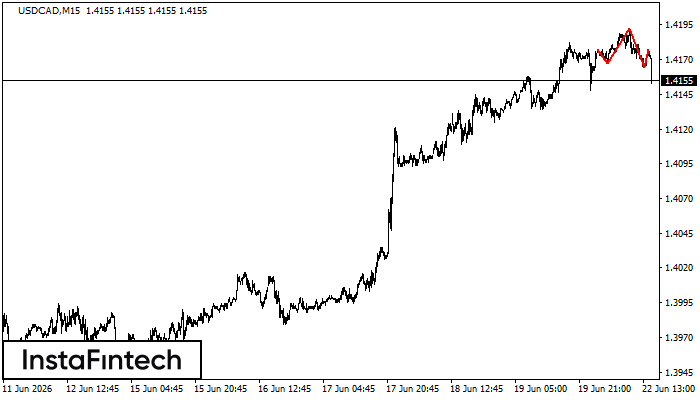
USDCAD M15
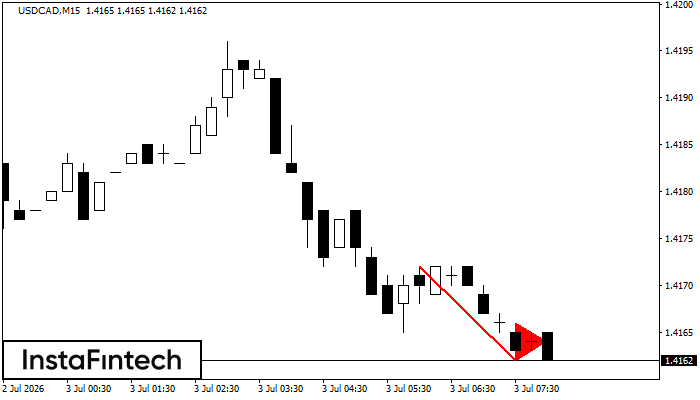
Bearish pennant
The Bearish pennant pattern has formed on the USDCAD M15 chart. This pattern type is characterized by a slight slowdown after which the price will move in the direction of the original trend. In case the price fixes below the pattern’s low of 1.4162, a trader will be able to successfully enter the sell position.
USDCAD M30
Double Top
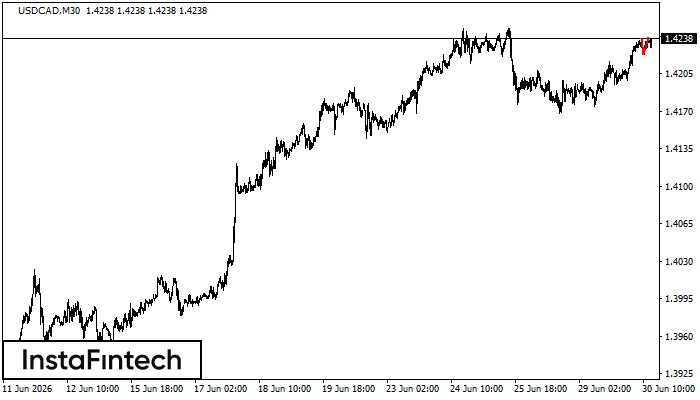
The Double Top pattern has been formed on USDCAD M30. It signals that the trend has been changed from upwards to downwards. Probably, if the base of the pattern 1.4223 is broken, the downward movement will continue.
USDCAD M15
Double Top
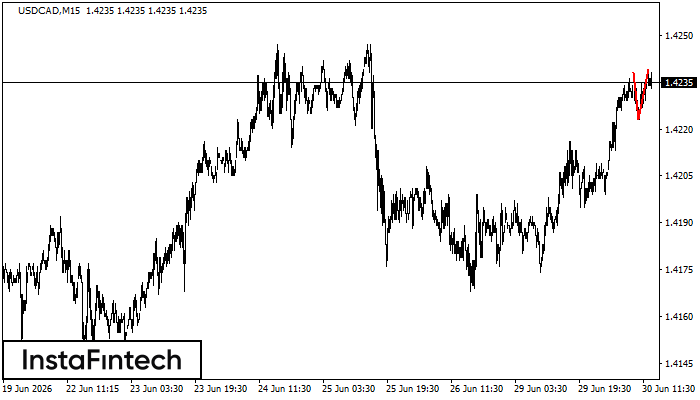
The Double Top pattern has been formed on USDCAD M15. It signals that the trend has been changed from upwards to downwards. Probably, if the base of the pattern 1.4223 is broken, the downward movement will continue.
USDCAD M5
Double Top
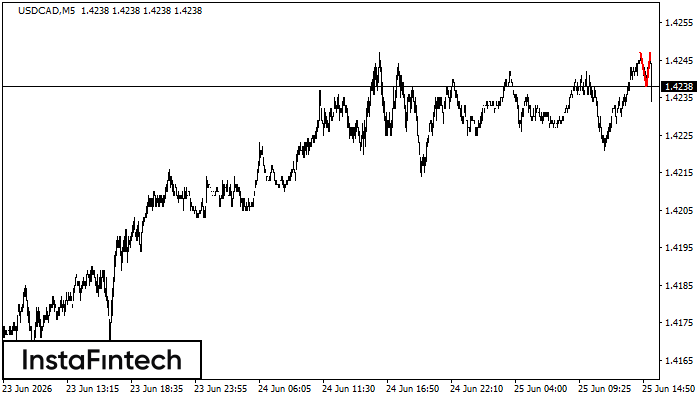
On the chart of USDCAD M5 the Double Top reversal pattern has been formed. Characteristics: the upper boundary 1.4247; the lower boundary 1.4238; the width of the pattern 9 points. The signal: a break of the lower boundary will cause continuation of the downward trend targeting the 1.4223 level.
USDCAD M5
Bearish Symmetrical Triangle
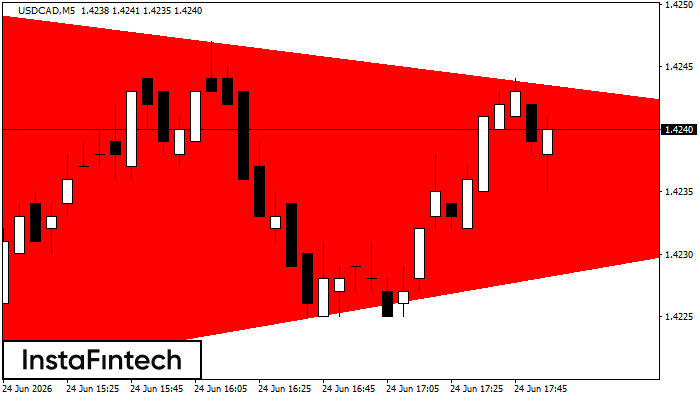
According to the chart of M5, USDCAD formed the Bearish Symmetrical Triangle pattern. This pattern signals a further downward trend in case the lower border 1.4220 is breached. Here, a hypothetical profit will equal the width of the available pattern that is -30 pips.
USDCAD M15
Head and Shoulders
The technical pattern called Head and Shoulders has appeared on the chart of USDCAD M15. There are weighty reasons to suggest that the price will surpass the Neckline 1.4167/1.4164 after the right shoulder has been formed. So, the trend is set to change with the price heading for 1.4141.