 中文
中文  Русский
 English
 Bahasa Indonesia
 Bahasa Malay
 ไทย
ไทย Español
 Deutsch
 Български
 Français
 Tiếng Việt
 বাংলা
বাংলা हिन्दी
 Čeština
 Українська
 Română
FX.co ★ Patterns USDJPY | US Dollar (USD) to Japanese Yen (JPY) Rate in the Forex market

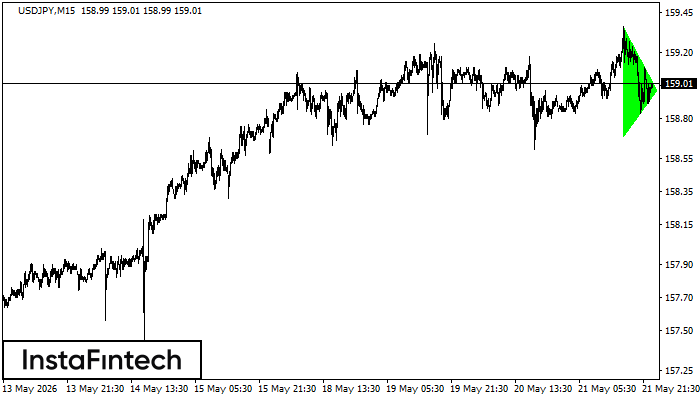
USDJPY M15
Bullish Symmetrical Triangle
According to the chart of M15, USDJPY formed the Bullish Symmetrical Triangle pattern, which signals the trend will continue. Description. The upper border of the pattern touches the coordinates 159.36/158.97 whereas the lower border goes across 158.68/158.97. The pattern width is measured on the chart at 68 pips. If the Bullish Symmetrical Triangle pattern is in progress during the upward trend, this indicates the current trend will go on. In case 158.97 is broken, the price could continue its move toward 159.20.
USDJPY M5
Double Bottom
The Double Bottom pattern has been formed on USDJPY M5. Characteristics: the support level 158.86; the resistance level 158.96; the width of the pattern 10 points. If the resistance level is broken, a change in the trend can be predicted with the first target point lying at the distance of 10 points.
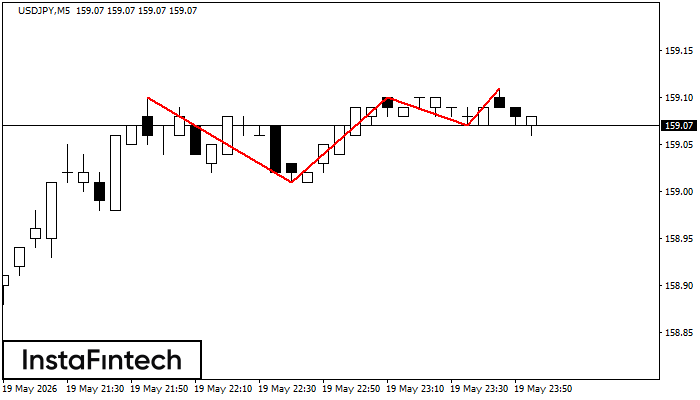
USDJPY M5
Triple Top
The Triple Top pattern has formed on the chart of the USDJPY M5 trading instrument. It is a reversal pattern featuring the following characteristics: resistance level -1, support level -6, and pattern’s width 9. Forecast If the price breaks through the support level 159.01, it is likely to move further down to 158.95.
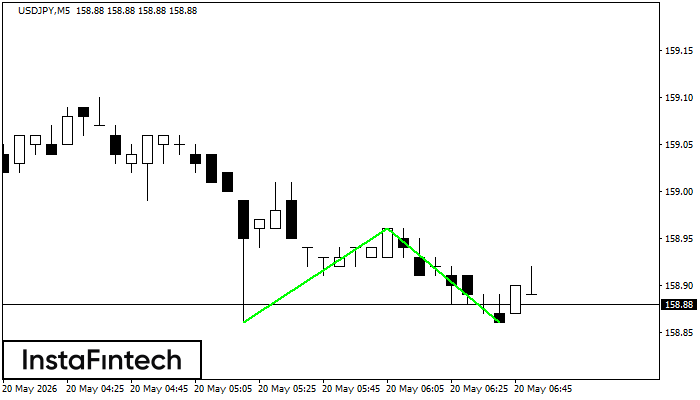
USDJPY M5
Head and Shoulders
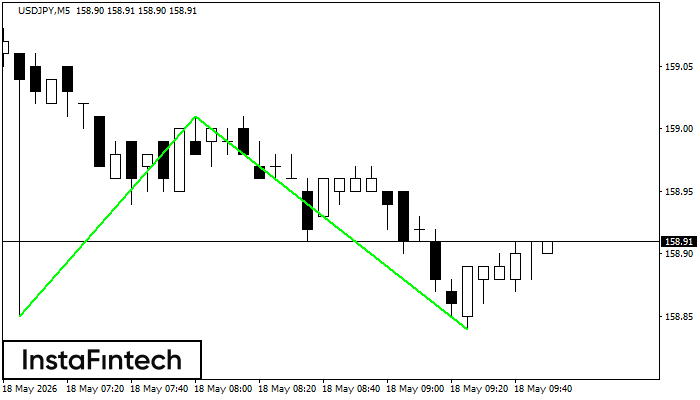
According to the chart of M5, USDJPY formed the Head and Shoulders pattern. The Head’s top is set at 159.08 while the median line of the Neck is found at 158.88/158.84. The formation of the Head and Shoulders pattern evidently signals a reversal of the upward trend. In other words, in case the scenario comes true, the price of USDJPY will go towards 158.69.
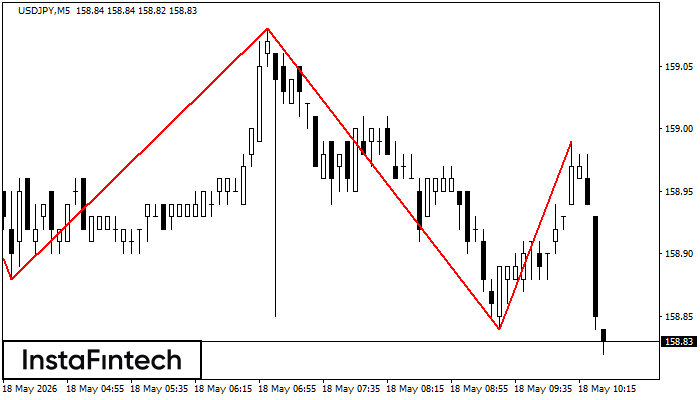
USDJPY M5
Double Bottom
The Double Bottom pattern has been formed on USDJPY M5; the upper boundary is 159.01; the lower boundary is 158.84. The width of the pattern is 16 points. In case of a break of the upper boundary 159.01, a change in the trend can be predicted where the width of the pattern will coincide with the distance to a possible take profit level.
USDJPY M5
Double Top
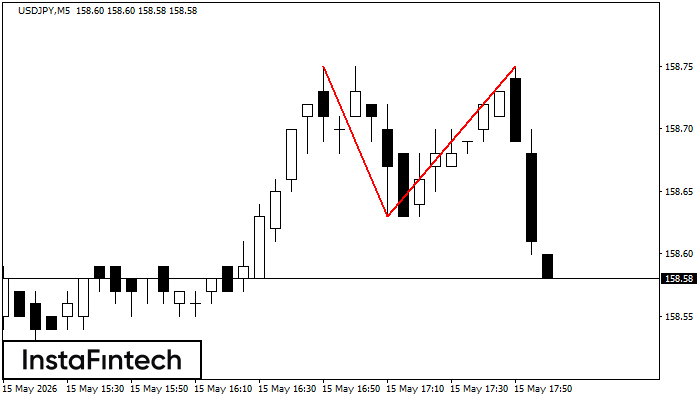
On the chart of USDJPY M5 the Double Top reversal pattern has been formed. Characteristics: the upper boundary 158.75; the lower boundary 158.63; the width of the pattern 12 points. The signal: a break of the lower boundary will cause continuation of the downward trend targeting the 158.48 level.
USDJPY M5
Bullish Rectangle
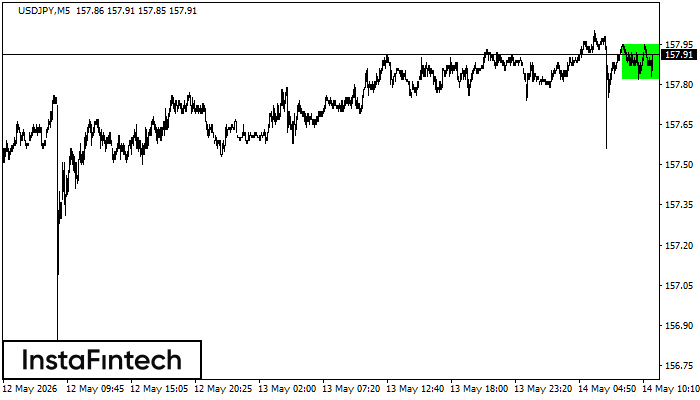
According to the chart of M5, USDJPY formed the Bullish Rectangle which is a pattern of a trend continuation. The pattern is contained within the following borders: the lower border 157.82 – 157.82 and upper border 157.95 – 157.95. In case the upper border is broken, the instrument is likely to follow the upward trend.
USDJPY H1
Bullish Rectangle
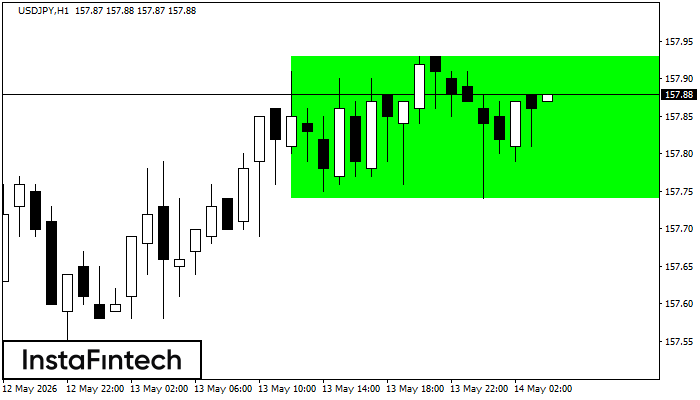
According to the chart of H1, USDJPY formed the Bullish Rectangle which is a pattern of a trend continuation. The pattern is contained within the following borders: the lower border 157.74 – 157.74 and upper border 157.93 – 157.93. In case the upper border is broken, the instrument is likely to follow the upward trend.
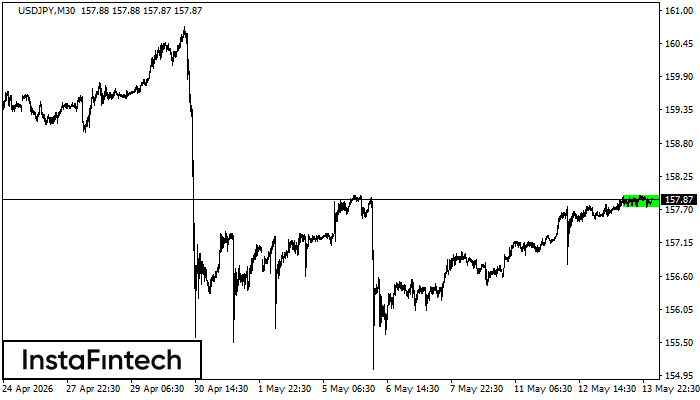
USDJPY M30
Bullish Rectangle
According to the chart of M30, USDJPY formed the Bullish Rectangle. This type of a pattern indicates a trend continuation. It consists of two levels: resistance 157.93 and support 157.74. In case the resistance level 157.93 - 157.93 is broken, the instrument is likely to follow the bullish trend.
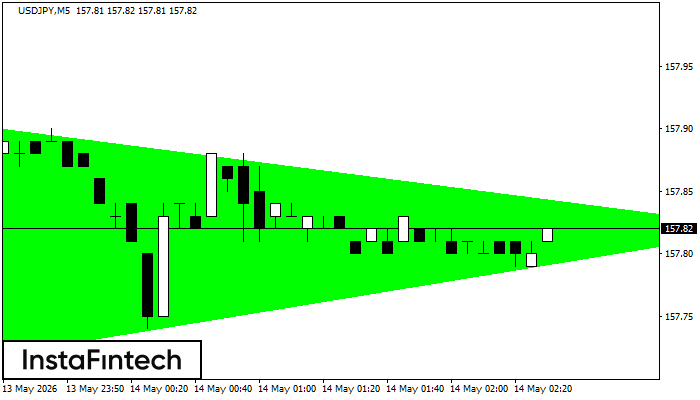
USDJPY M5
Bullish Symmetrical Triangle
According to the chart of M5, USDJPY formed the Bullish Symmetrical Triangle pattern. Description: This is the pattern of a trend continuation. 157.91 and 157.71 are the coordinates of the upper and lower borders respectively. The pattern width is measured on the chart at 20 pips. Outlook: If the upper border 157.91 is broken, the price is likely to continue its move by 157.97.